
Fig. 6.
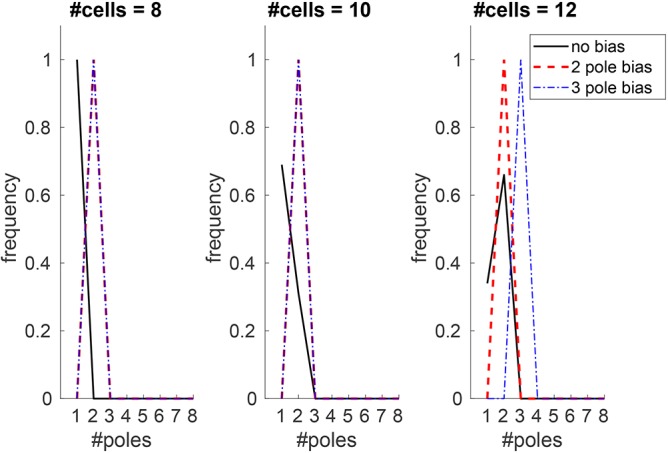
Heterogeneous input of auxin can establish robust patterns that might otherwise be unstable. Pole frequency plots for differently sized templates based on 100 simulations. All simulations have stochastic fluctuations in initial auxin according to a normal distribution (see supplementary Materials and methods for details). The black lines represent simulations with uniform auxin production (as in Figs 4 and 5). Red dashed lines represent a persistent bias in auxin production in two opposite cells; blue dot-dashed lines represent a temporary bias in auxin input in three approximately equally spaced cells (owing to the restrictions from using integer values).