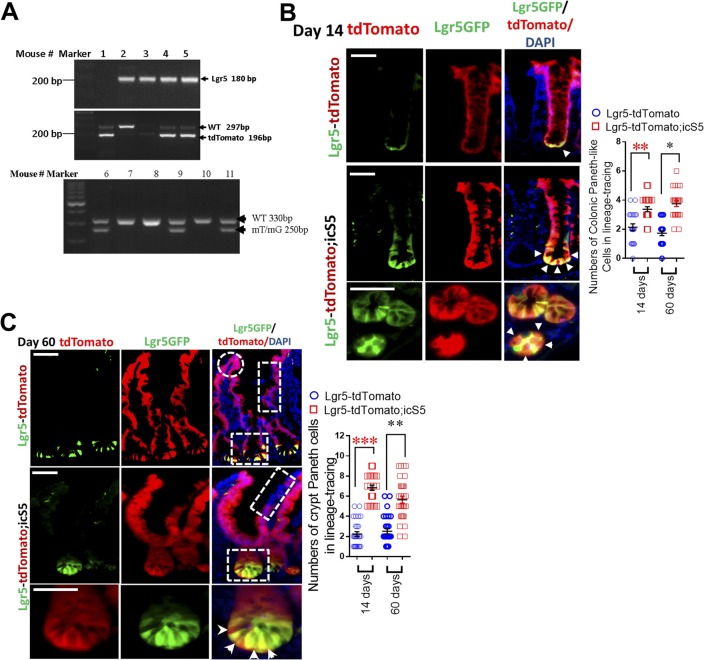
Figure S3. Ca-pYSTAT5 signaling enhances lineage tracing at crypt bases.
(A) Genotyping PCR of Lgr5-Rs26tdTomato and RosamT/mG mice. (B) Lgr5CreER mice were crossed with RstdTomato mice to generate a mouse line (Lgr5-tdTomato), then crossed with icS5 floxed mice. Ileal lineage tracing was done and analyzed 60 d after a single dose of Tam (25 mg/kg), n = 3 per group. Numbers of Paneth cells labeled by tdTomato were counted 14 or 60 d after a single dose of Tam. Results are expressed as mean ± SEM, t tests was used to compare the significance of a difference, n ≥ 3 mice each group, ***P < 0.001 versus Lgr5-tdTomato mice. (C) Lgr5CreER mice were crossed with RstdTomato mice to generate a mouse line (Lgr5-tdTomato), then crossed with icS5. Colonic lineage tracing was done and analyzed 14 d after a single dose of Tam (25 mg/kg), n = 3 per group. Numbers of colonic Paneth-like cells labeled by tdTomato were counted 14 or 60 d after a single dose of Tam. Results are expressed as mean ± SEM, t tests was used to compare the significance of a difference, n ≥ 3 mice each group, **P < 0.01 or *P < 0.05 versus Lgr5-tdTomato mice.

