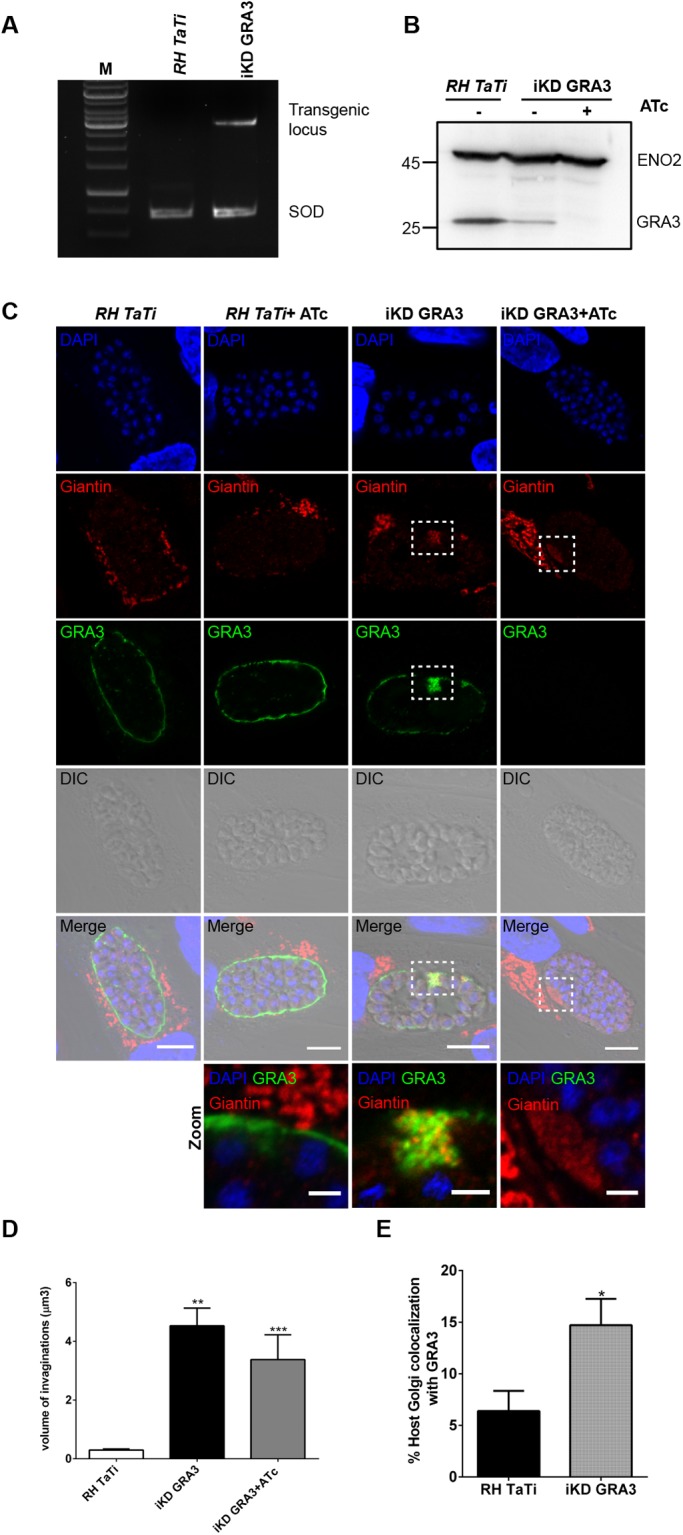
Fig. 4.

Inducible TgGRA3 depletion affects host Golgi recruitment and entry at the PVM. (A) Agarose gel of PCR showing correct integration of the transgene into TgGRA3 locus. SOD (superoxide dismutase) is used as a PCR loading control. (B) Western blot analysis demonstrating the decrease in TgGRA3 protein level in iKD-GRA3 mutants. ATc treatment depleted TgGRA3 protein expression in iKD-GRA3 mutants. Eno2 is used as a loading control. (C) Representative z-stack from confocal microscopy images of HFF cells infected with RH TaTi parental strain and iKD-GRA3 in absence or in presence of ATc. At 35 h post-infection, iKD-GRA3 parasites indicated abnormal accumulations of host Golgi material at the PVM (white dashed squares). A magnification of this region is presented in the lower panel. The host Golgi marker giantin (red), PV marker TgGRA5 (green), and nuclei (DAPI) were stained. Scale bars: 10 µm (5 µm in magnified regions). (D) Histogram quantifying PV invagination volume. Invagination volumes (n=80) were measured from three-dimensional reconstructions of 30 parasitophorous vacuoles for each condition, **P value<0.0001, ***P value=0.0005 (unpaired t-test). Results are reported±s.e.m. (E) Histogram quantifying the percentage of co-localization between TgGRA3 and the cis-Golgi marker giantin. Three-dimensional reconstructions were done on 12 parasitophorous vacuoles for each condition, *P value=0.0242 (unpaired t-test). Results are reported±s.e.m.
