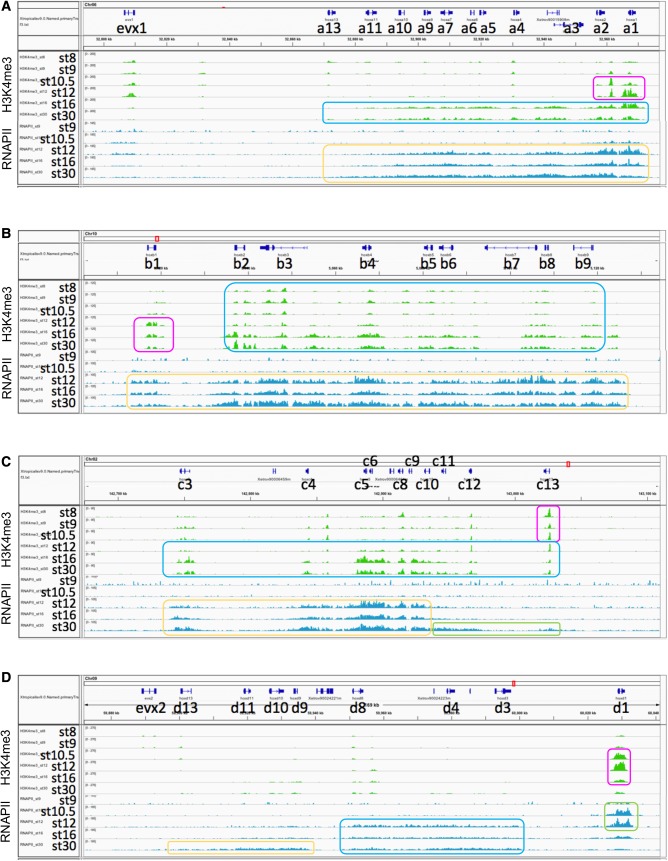
Fig. 4.
Epigenetic and Pol II marks on the Hox clusters. (A) HoxA. H3K4me3 marks were first prominent on hoxa1 and hoxa2 at stage 10.5 (magenta box). These marks are later at stage 16 found on a wide region of the cluster (blue). Pol II (RNAPII) marks were prominent on the entire hoxa region at stage12 onward (yellow), and the levels are higher on hoxa1 and hoxa2 than the others at stage 12. (B) HoxB. H3K4me3 marks were prominent on hoxb2 to hoxb9 from early stages (stages 8–10.5) onward (blue), but at stage 12, those on hoxb1 (magenta) were relatively higher than the others, which may correspond to the qPCR results (see Table 2). RNAPII marks were apparent on all hoxb genes from stage 12 with no distinct order (yellow), inconsistent with the qPCR data. (C) HoxC. H3K4me3 marks were first conspicuous on hoxc13 at early stages (magenta). The marks covered all hoxc genes between stage 12 and stage 16 (blue), inconsistent with the difference of initiation timing between hoxc3 and hoxc6. Salient RNAPII marks were on hoxc3 to 10 (yellow), earlier than hoxc11 to 13 (green). RNAPII marks appeared to be relatively higher on hoxc6 than hoxc3 at stage 12, supporting the qPCR data. (D) HoxD. H3K4me3 marks were prominent on hoxd1 (magenta), but almost no marks were on hoxd3 to hoxd13 at any stages. Increase of RNAPII binding on the HoxD cluster may be divided into three parts, hoxd1 at stages 10.5 and 12 (green), followed by hoxd3 to 8 (blue), then hoxd9 to 13 (yellow), corresponding to the qPCR data of hoxd1 and hoxd3. The ordinate represents mapped sequence read counts (see the Materials and Methods). Gene models for primary transcripts are shown on the top of panels.

