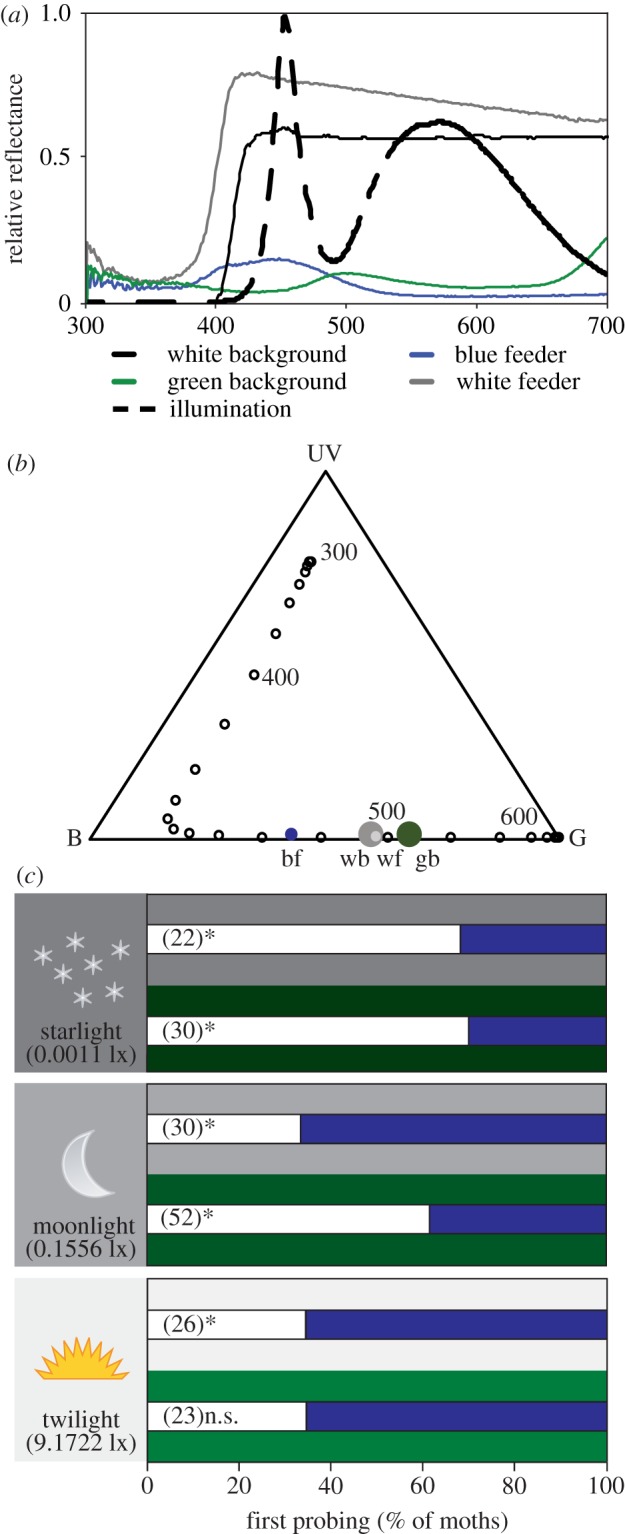
Figure 1.

(a) Spectral distribution of the lights used in the experiment and relative spectral reflectance of experimental backgrounds and feeders. (b) Maxwell colour triangle depicting the colour space of stimuli and background colours. UV, B and G denote the colours exciting only the UV, blue and green receptors, respectively. We used the spectral absorption curves of the photoreceptors of the hawkmoth Macroglossum stellatarum, assuming they are similar to those of the closely related Manduca sexta; bf: blue feeder, wf: white-UV feeder, wb: white-UV background, gb: green background. (c) Colour choices of naive M. sexta hawkmoths between the white-UV feeder (white stacked bars) and blue feeder (blue stacked bars) offered against a light, white-UV background (white/grey backgrounds behind stacked bars) or a dark, green background (green backgrounds behind the stacked bars) under three different illuminances resembling starlight (upper panel), moonlight (middle panel) and twilight (lower panel). Numbers in parentheses represent the number of independent replicates for each treatment. *p < 0.05; n.s: p = 0.0585. See text for details.
