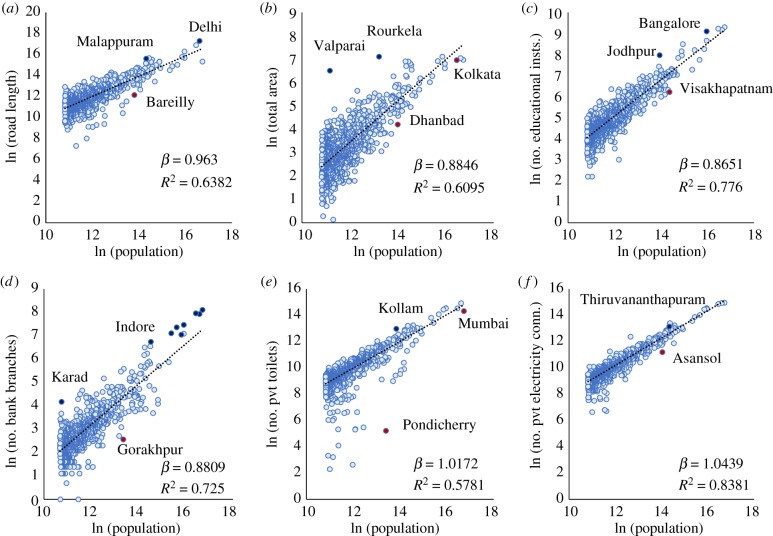
Figure 1.
Scaling of public and private infrastructure with population. Each panel shows the total value for each city (light blue circle) and the scaling best fit line, equation (1.1); the best fit estimate for the exponent β and the goodness of fit R2 are also shown, see table 1 and electronic supplementary material, appendix A for details. Urban indicators shown are (a) road length, (b) total area, (c) educational institutions, (d) bank branches, (e) private toilets and (f) private electricity connections. All data from the Census of India 2011, see electronic supplementary material, appendix A for details. (Online version in colour.)

