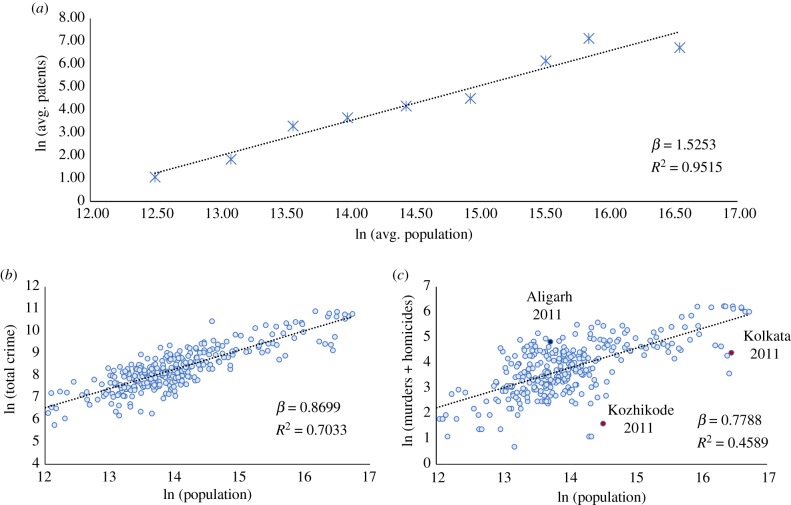
Figure 2.
Scaling of technological innovation and crime in Indian urban agglomerations with population. (a) Patents filled with the Office of the Controller General of Patents Designs and Trademarks (Intellectual Property India) for the years 2004, 2006, 2008, and 2011, averaged in logarithmic bins. (b) Total crime, and (c) number of murders and culpable homicides under the Indian Penal Code from the National Crime Records Bureau for the years 1991, 1996, 2001, 2006, and 2011. (Online version in colour.)

