Figure 4.
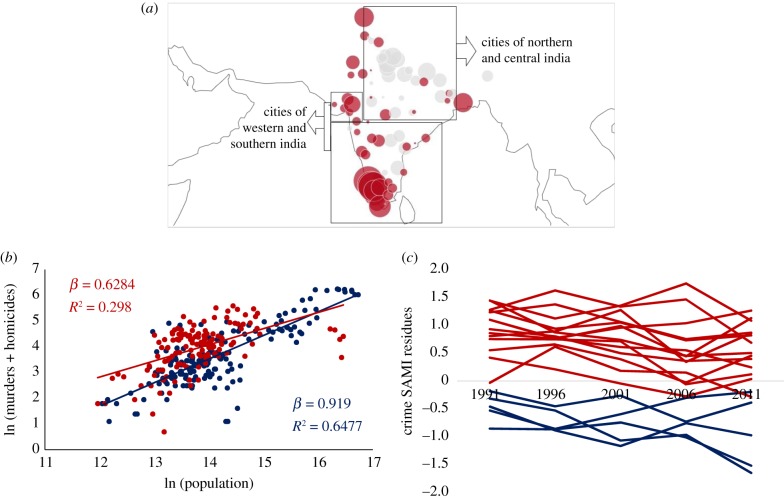
Spatial and temporal analysis of crime residuals. (a) Spatial distribution of crime SAMIs in 2011: red (grey) dots correspond to deviations below (above) expectation for city size. The size of the circle denotes the magnitude of crime SAMIs. (b) Murders & culpable homicides versus population. Red group: cities in northern and central India. Blue group: cities in southern and western India. (c) Temporal evolution of crime SAMIs for select cities between 1991 and 2011. Blue lines: cities in northern and central Indian states of Uttar Pradesh (Agra, Aligarh, Allahabad, Bareilly, Gorakhpur, Kanpur, Lucknow, Meerut, Moradabad, Varanasi), Madhya Pradesh (Bhopal, Indore, Jabalpur), and Bihar (Patna). Red lines: cities in southern Indian states of Kerala (Kochi, Thiruvananthapuram), and Tamil Nadu (Chennai, Coimbatore, Madurai). (Online version in colour.)

