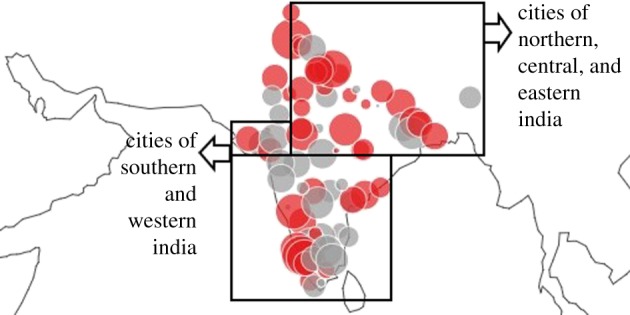
Figure 9.

Spatial analysis of innovation SAMI residuals in 2011. Red (grey) dots correspond to deviations below (above) expectation for city size. The size of the circle denotes the magnitude of the corresponding innovation SAMI. (Online version in colour.)
