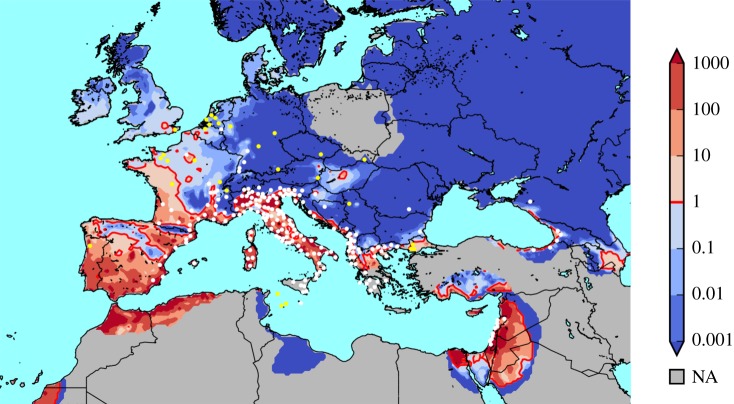
Figure 2.
Spatial validation. White dots show established Ae. albopictus populations, yellow dots show one-time sightings. Background colours show the simulated suitability index of the period 2006–2016. Red contour distinguishes suitable (E0 > 1) from unsuitable areas (E0 < 1). In the grey area, climate data from the E-OBS dataset was incomplete for all years of the study period. (Online version in colour.)

