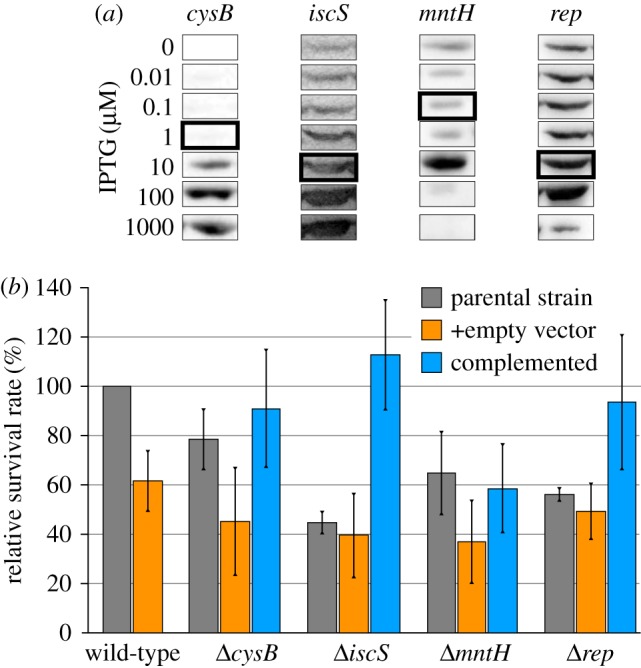
Figure 2.

Protein levels and plasma sensitivity of complemented deletion strains. (a) Western blot analysis with anti-His5 antibody was performed to measure protein levels at different IPTG concentrations. The IPTG concentrations of the highlighted expression levels were chosen for the plasma sensitivity assay. (b) Complementation was performed by inducing with 0.1 µM IPTG (mntH), 1 µM (cysB) or 10 µM (iscS, rep). Strains harbouring the empty vector (pCA24N) served as control. Relative survival rates were calculated by dividing the CFU of plasma-treated samples by the CFU of the gas-treated control and by subsequently normalizing to the wild-type (set to 100%). Experiments were performed three times independently. Averages and standard deviations are shown. (Online version in colour.)
