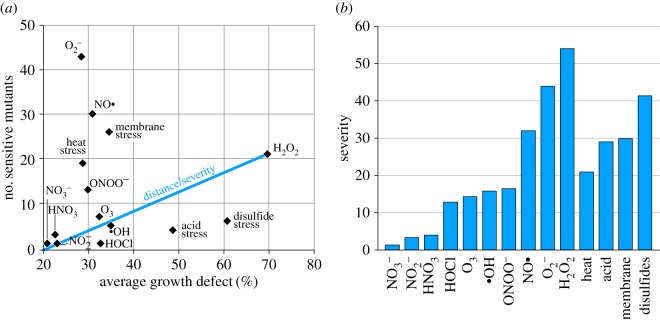
Figure 4.
Comparison of the importance of individual stressors. (a) The number of knockout mutants with a growth defect greater 20% were plotted against the average growth defect of those strains. To illustrate the calculation of the severity score, the distance of the stressor H2O2 to the point of origin is shown as an example. (b) Severity score based on the Euclidean distance of each stressor from the point of origin. (Online version in colour.)

