Figure 6.
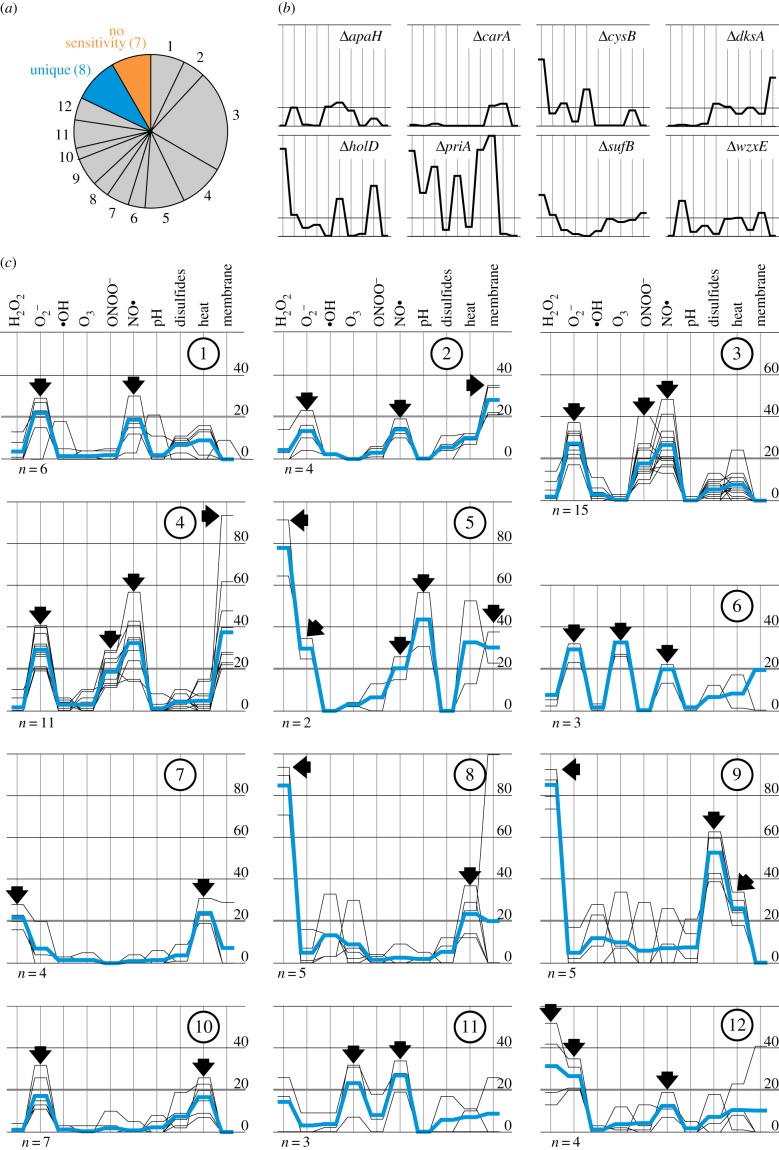
The mutants were clustered based on their sensitivity against plasma-relevant stressors. (a) Mutants are grouped into 12 clusters, strains with unique profiles and strains not sensitive to any of the tested stressors. (b) Stressor profiles of the strains with unique stressor profiles. The order of the stressors is the same as in (c). (c) The 12 clusters (numbered 1–12) were generated using the k-mean++ clustering algorithm. Arrows mark the stressors characteristic for each cluster; n indicates the number of strains in the cluster and blue lines represent the average stressor profile of the cluster members. (Online version in colour.)

