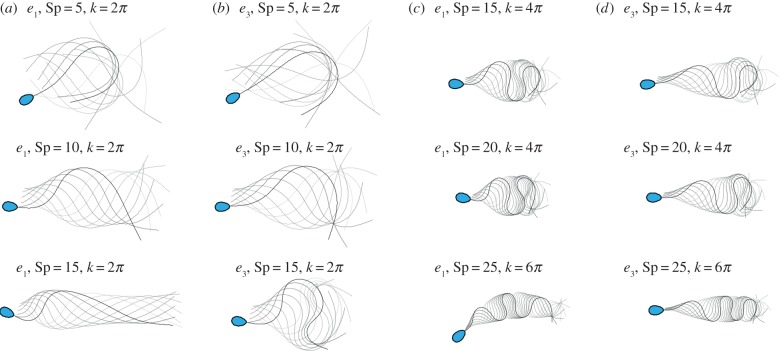
Figure 3.
Snapshots of flagellar evolution for the tapering functions e1 and e3, and six distinct pairs of wavenumber and sperm-compliance number (Sp, k) across the parameter space, as indicated, plotted at equal time intervals over one period (darker curves denote later times and the sperm head is only shown at final time for clarity). In particular, there are four columns and three rows. In columns (a,b) one has the profiles e1 and e3, with the sperm number then increasing on descending the rows. In columns (c,d) the wavenumber is increased, as is the sperm number; again, one has the profiles e1 and e3 with sperm number increasing on descending the rows. The values of force amplitude a, for each row, from (a) to (d) are, respectively, a = 2.24, 2.54, 1.96, 2.37, a = 2.02, 2.93, 2.04, 2.55 and a = 2.54, 3.63, 1.30, 2.21, after non-dimensionalization with E0/ℓ3, where ℓ = L/Sp. (Online version in colour.)

