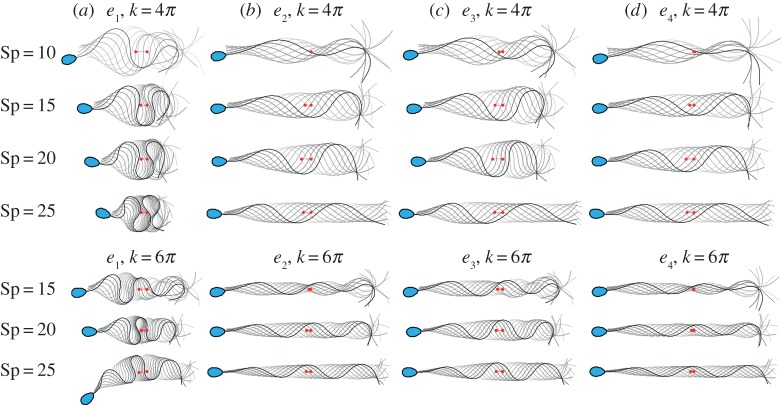
Figure 4.
Snapshots of the flagellar evolution for the tapering functions (a–d) e1 − e4, and seven distinct pairs of wavenumber and sperm-compliance number (Sp, k), as indicated, plotted at equal time intervals over one period (darker curves denote later times and the sperm head is only shown at final time for clarity). The same force amplitude, a, given by the upper limit of the tapering case e1 consistent with the absence of self-intersection (as discussed in the final paragraph of §2.4) is used for the other stiffness functions e2, e3 and e4. The value of a for each row, from top to bottom, is thus a = 2.08, 1.96, 2.04, 2.09, 2.22, 1.81, 1.3, non-dimensionalized by E0/ℓ3, where ℓ = L/Sp. Red markers depict the initial and final position of the flagellum centroid over a period. (Online version in colour.)

