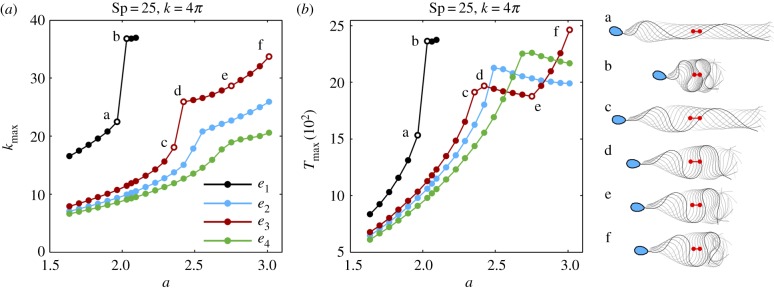
Figure 7.
The maximum curvature κmax (a) and the maximum absolute tension Tmax (b), over one period, as a function of the maximal sliding force density magnitude, a, non-dimensionalized by E0/ℓ3, where ℓ = L/Sp. This magnitude is limited for the e1 curves to ensure the absence of flagellar self-intersection, as detailed in the final paragraph of §2.4. The same points ‘a–f’ in (a) are depicted in (b), in addition to the associated beating shape, on the right side of (b), with the sperm head only shown at final time for clarity. Red markers depict the initial and final position of the flagellum centroid over a period. (Online version in colour.)

