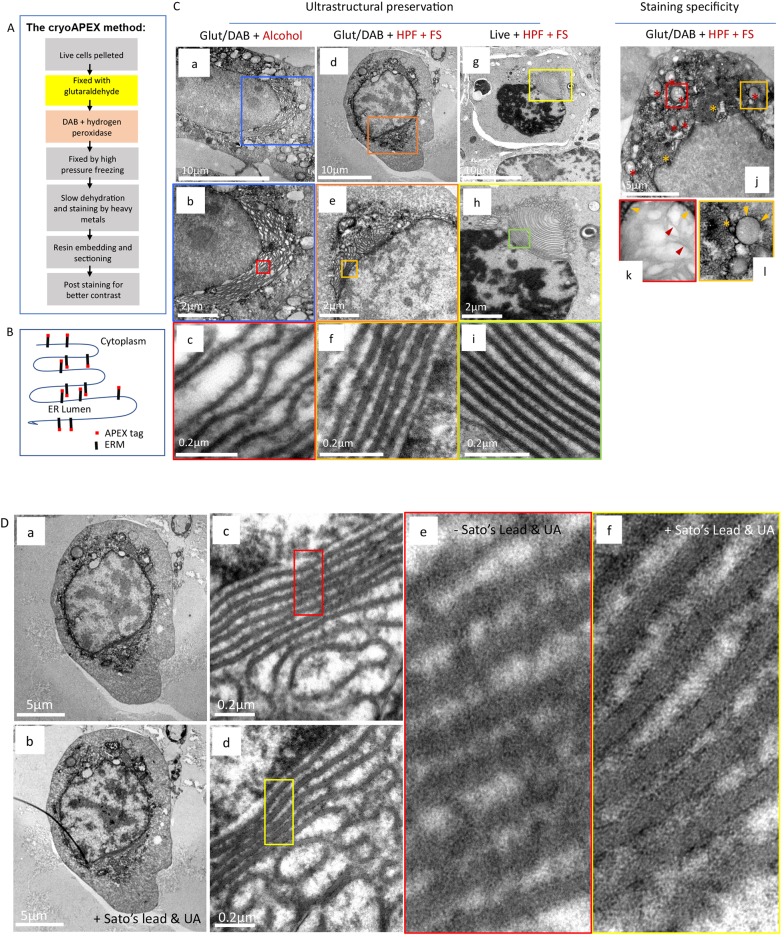
Fig. 2.
OSER as a system for evaluating membrane preservation and staining specificity. (A) Flowchart describing cryoAPEX. (B) Schematic of APEX-tagged ERM expressed on the cytosolic face of the ER membrane. (C) The reorganized ER morphology in chemically fixed, DAB reacted ERM–APEX2-expressing cells that were processed via traditional chemical fixation and alcohol dehydration (a–c) or by cryoAPEX (d–f) was compared to ERM–APEX2 expressing cells that were cryofixed live and without the DAB reaction (g–i). The live cryofixed cells (g–i) represent the best attainable ultrastructural preservation and serve here as the metric for evaluating membrane preservation obtained via the two APEX-based detection protocols (a–f). The high specificity of staining obtained by cryoAPEX is exemplified in the images in panels j–l. Here, thin-section images of cells expressing ERM–APEX2 processed by cryoAPEX show preferential staining of the reorganized ER (j, orange asterisks) and the outer mitochondrial membrane (red asterisks in j and orange arrowheads in k–l, respectively) but not of the mitochondrial cristae (k, red arrowheads). (D) Post-staining with heavy metals improves definition of preferentially stained membranes. Post-staining of thin sections with heavy metals using uranyl acetate and Sato's lead solution following cryoAPEX provides additional contrast, thereby improving resolution. Shown are thin sections of the same cell imaged in Fig. 2Cd before (a,c,e) and after (b,d,f) post-staining. Comparison of panels e and f clearly shows improved definition and the resolution of membranes at high magnifications in post-stained samples (f). UA, uranyl acetate.

