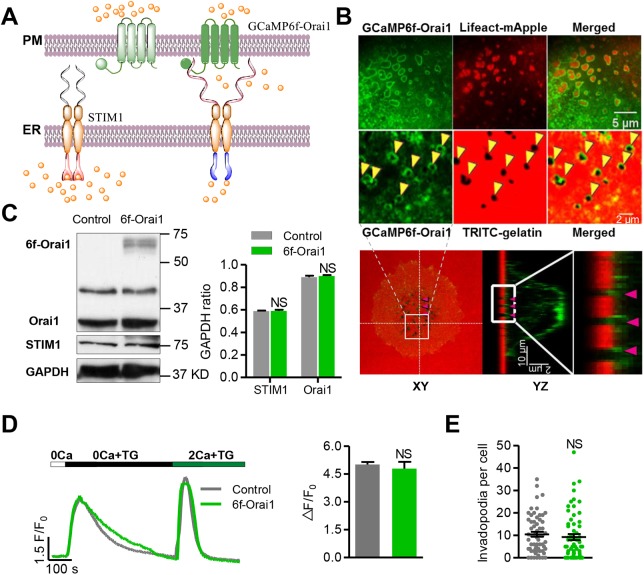
Fig. 1.
Targeting the Ca2+ biosensor GCaMP6f to the plasma membrane. (A) Schematic showing the design strategy of the GCaMP6f-Orai1 Ca2+ biosensor. GCaMP6f was fused to the N-terminus of Orai1 (GCaMP6f-Orai1) to target it to the plasma membrane with preferential accessibility to Orai1-mediated Ca2+ entry. This vector was expressed in WM793 cells by adenoviral infection. (B) Localization of GCaMP6f-Orai1. Upper panel: confocal images of GCaMP6f-Orai1 (top left), invadopodia visualized by Lifeact-mApple fluorescence (top middle) or degradation holes (arrowheads) left after TRITC-labeled gelatin was digested (bottom middle, an enlarged view of the cell area is indicated in the lower panel), and their merged images. Note that the GCaMP6f-Orai1 fluorescence encircles invadopodia. Lower panel: orthogonal views of confocal z stacks, showing the localization of the targeted sensor: XY view (left), YZ view (middle) and an enlarged view of the boxed area indicated in the YZ view (right). (C) Western blots (left) showing the expression of GCaMP6f-Orai1 and its effect on endogenous STIM1 and Orai1 levels, and quantification (right). (D) Effects of biosensor expression on thapsigargin (TG)-induced SOCE. Left: after store Ca2+ release induced by 5 μM TG in 0 Ca2+ solution, reintroducing Ca2+ into the extracellular solution elicited SOCE. Note that Rhod4 indicated similar release and SOCE-induced cytosolic Ca2+ responses in control and GCaMP6f-Orai1-expressing cells. Right: statistics of the magnitude of SOCE, indexed by ΔF/F0 of Rhod4 after Ca2+ restoration following store depletion. n=172 and 49 cells from 7 independent experiments for control and GCaMP6f-Orai1 groups, respectively. (E) The number of invadopodia per cell was unaltered by biosensor expression. n=62 cells from 4 independent experiments for both groups. Data represent mean±s.e.m.; NS, not statistically significant.

