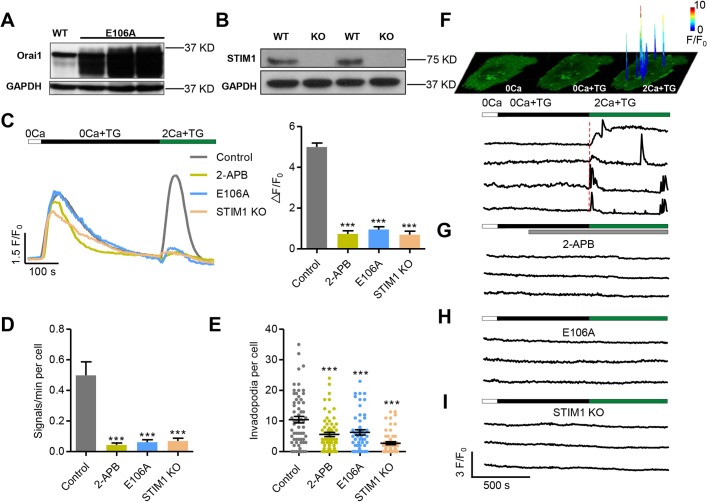
Fig. 4.
Invadopodial Ca2+ glows originate from SOCE mediated by Orai1 and STIM1. (A,B) Manipulating SOCE in WM793 cells. Western blots showing the expression of the dominant-negative mutant Orai1-E106A (E106A) (A) and knockout of STIM1 (STIM1 KO) (B). (C) Representative traces (left) and average amplitude (right) of SOCE recorded by Fluo4. 100 μM 2-APB was added to the extracellular solution when the fluorescence returned to baseline after TG treatment. Note that ER Ca2+ release was largely comparable in these groups (n=69, 32, 61 and 83 cells from 3, 3, 9 and 3 independent experiments for control, 2-APB, E106A and STIM1 KO groups, respectively). (D) Statistics of the frequencies of spontaneous invadopodial Ca2+ glows (n=54, 18, 21 and 36 cells from 30, 8, 16 and 25 independent experiments for control, 2-APB, E106A mutant and STIM1 KO groups, respectively). (E) Depression of invadopodial formation by treatment with 2-APB (n=66), expression of the E106A mutant (n=52) and STIM1 KO (n=57) compared with control (n=62) from 6 independent experiments. (F) Invadopodial Ca2+ glows resolved during global SOCE. Top: space-time plots of local Ca2+ events reported by GCaMP6f-Orai1 in response to 0 Ca, TG and subsequent 2 mM Ca2+ in a WM793 cell. The colored peaks are overlays of surface plots of discrete Ca2+ glows at their peaks, indicating both the locations and the amplitudes (coded by colors) of these local signals. Bottom: corresponding traces of representative invadopodial Ca2+ glows during global SOCE. Note the initial near-synchronous activation at all invadopodia followed by delayed, asynchronous activity at individual invadopodia. (G–I) Invadopodial Ca2+ glows were abolished by 2-APB treatment (G), expression of the E106A mutant (H) and STIM1 KO (I). Data are presented as mean±s.e.m.; ***P<0.001 compared with control.

