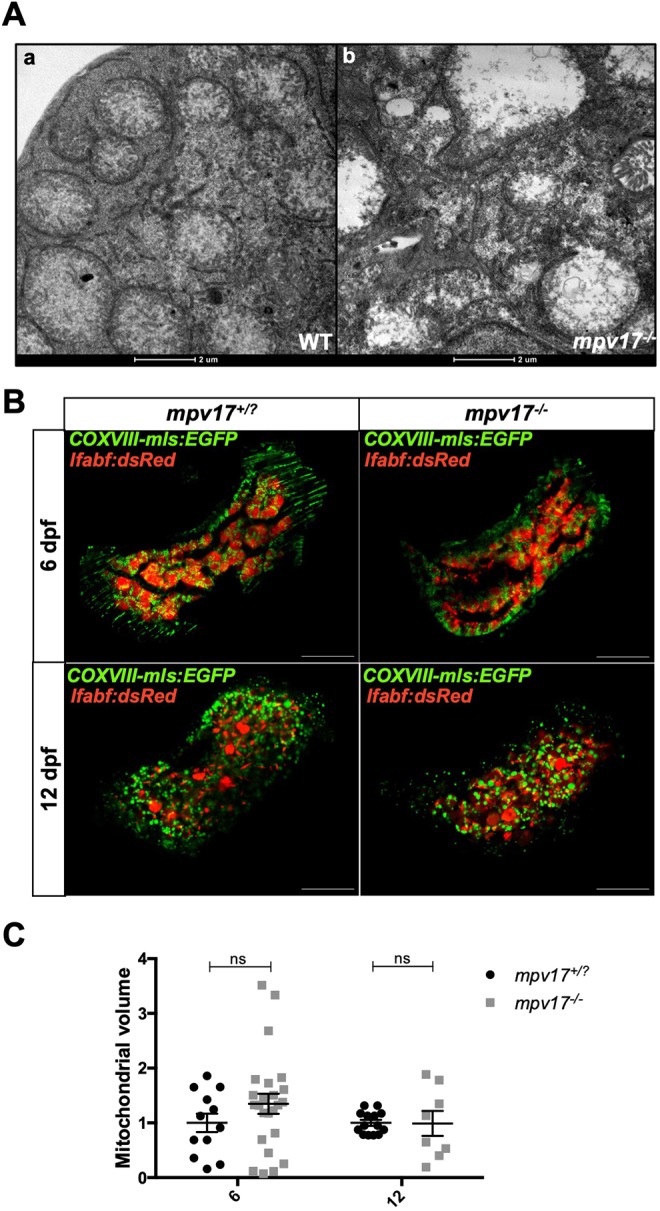
Fig. 2.

Analysis of mitochondrial ultrastructure and volume in mpv17−/− and wild-type liver at 6 dpf. (A) TEM analysis of wild-type (a) and mpv17−/− liver hepatocytes (b) (n=3). Scale bars: 2 µM. (B) Confocal images of double Tg(COXVIII-mls:EGFP); Tg(lfabp:dsRed) mpv17+/? and mpv17−/− siblings at 6 dpf (n=13) and 12 dpf (n=8). Scale bars: 50 µm. (C) Relative quantification of integrated density. Statistical analyses were performed using two-tailed Student's t-test. Statistical significance was evaluated by setting a confidence interval of 95%; data are mean±s.e.m. ns, not significant. Experiments were performed in biological replicates.
