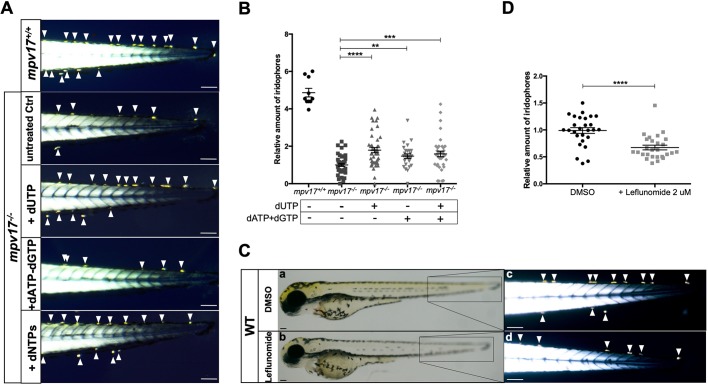
Fig. 5.
Investigation of dNTP metabolism in zebrafish larvae. (A) Visualization of iridophores in the tail region of 3 dpf larvae treated with different mixtures of dNTPs. (B) Relative quantification of iridophore number (n=27). (C) Wild-type embryos were treated with dimethyl sulfoxide and 2 μM leflunomide, inhibitor of pyrimidine biosynthesis. Whole-body bright-field pictures (a,b) and birefringent images of the tail region (c,d) are shown. (D) Quantification of relative amounts of iridophores (n=27). Arrowheads point to iridophores. Scale bars: 100 µm. Statistical analyses were performed using two-tailed Student's t-test. Statistical significance was evaluated by setting a confidence interval of 95%; data are mean±s.e.m. ****P<0.0001; ***P<0.001; **P<0.01. Experiments were performed in biological replicates.

