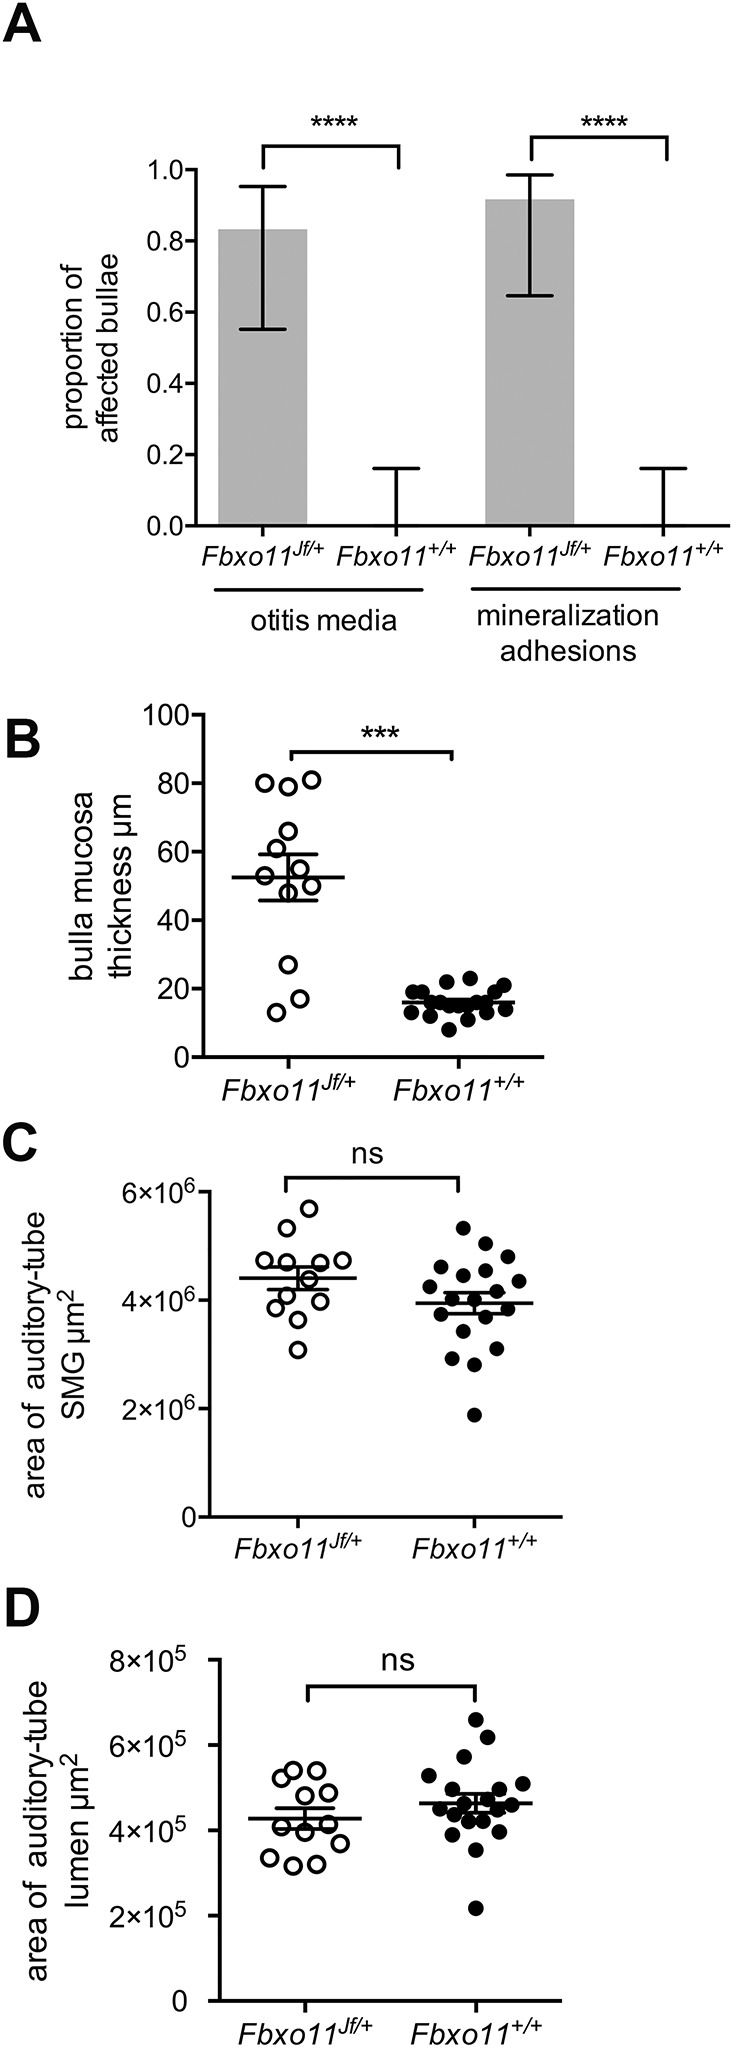
Fig. 5.

Prevalence of otitis media in P105-P119 Fbxo11 mice and morphometric analysis of auditory-tube SMGs and auditory tubes. (A) The proportion of Fbxo11Jf/+ bullae (n=12) with otitis media and mineralization and adhesions is high, but absent in Fbxo11+/+ bullae (n=20). (B) Fbxo11Jf/+ bulla mucosa is thickened. Cumulative areas of (C) auditory-tube SMGs and (D) auditory-tube lumen measured in 50-µm step sections are the same in Fbxo11Jf/+ and Fbxo11+/+ bullae. The histogram bar in A represents the mean and the error bars 95% confidence interval for each proportion. Frequency data were analyzed with Fisher's exact tests. Data in graphs B-D are represented as points; the error bars are mean±s.e.m. Data was analyzed with Student’s t-tests. Two-tailed tests: ns, not significant (P>0.05), ***P<0.001, ****P<0.0001.
