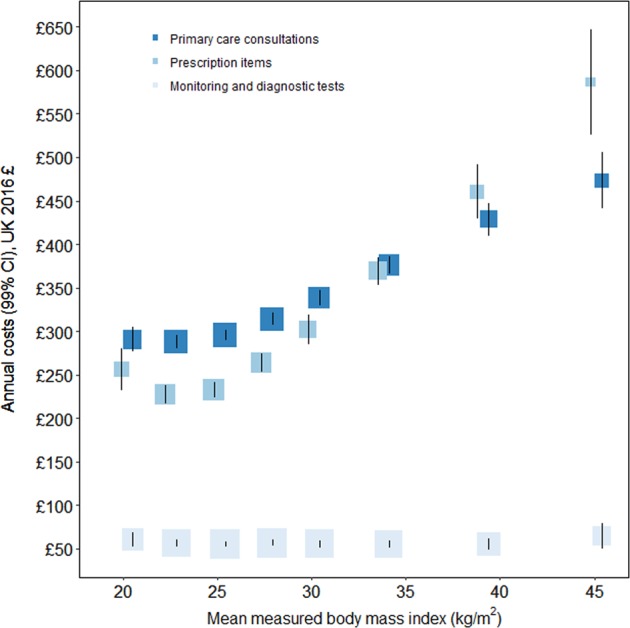
Fig. 1.

Annual primary care consultation, test, and prescription costs per person by category of body mass index. The standardised estimates of mean annual costs (in UK 2016 prices) are adjusted for age, region of recruitment, deprivation, educational qualifications, parity, age at birth of first child, smoking, alcohol intake, financial year, and proportion of year with contributed data. Annual costs are plotted against mean measured BMI (with a small offset to avoid overlaid CIs) within categories of self-reported BMI from the combined 2012 and 2013 Health Surveys for England (Table S6). The area of each square is inversely proportional to the variance of that estimate. The error bars show 99% CIs
