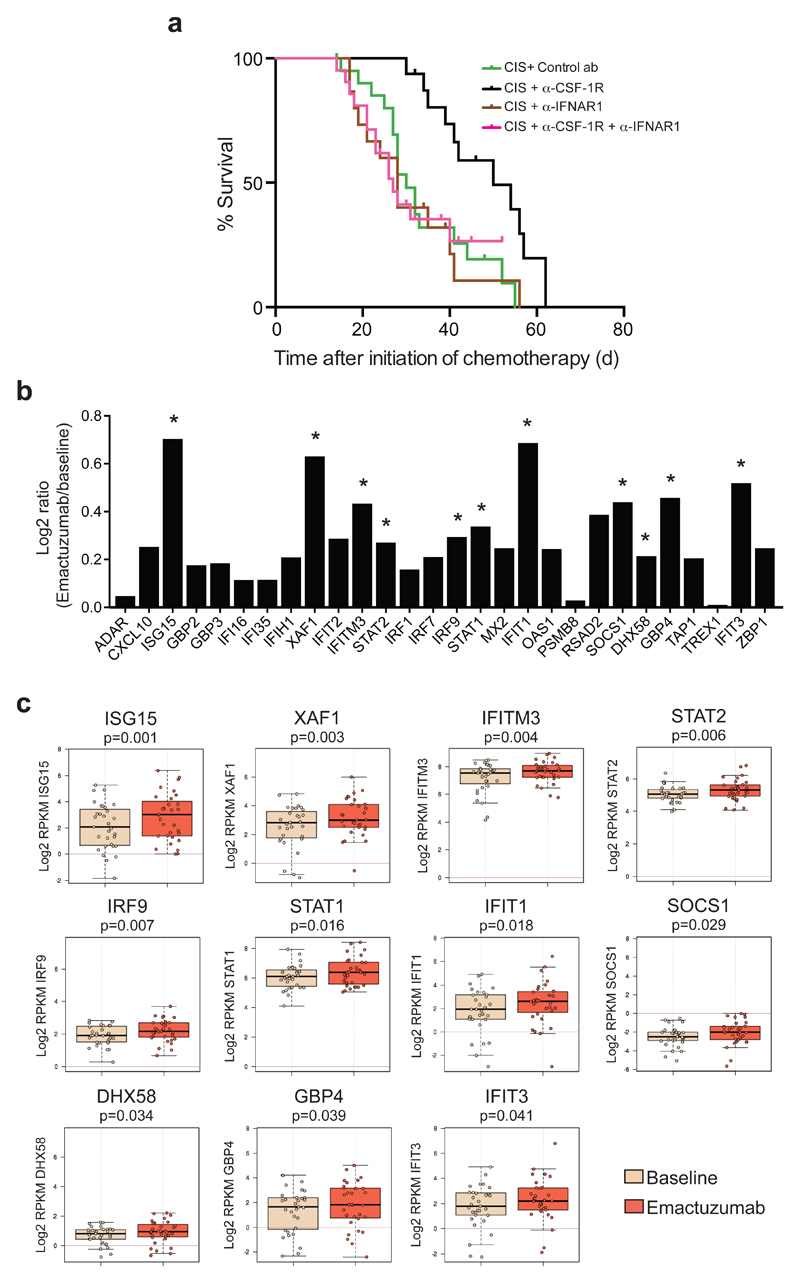
Figure 4. CSF-1R blockade increases the expression of intratumoral type I IFN signaling in cancer patients treated with emactuzumab and is essential for the therapeutic synergy of cisplatin/anti-CSF-1R in the K14cre;Cdh1F/F;Trp53F/F mouse model.
(a) Kaplan-Meier tumor-specific survival curves of KEP mice treated with cisplatin/control ab, cisplatin/anti-CSF-1R (same groups as in Fig. 1f), cisplatin/anti-IFNAR1 (n=15 animals), or cisplatin/anti-CSF-1R/anti-IFNAR1 (n=21 animals). Cisplatin/anti-CSF-1R versus cisplatin/anti-CSF-1R/anti-IFNAR1, p=0.0064 (two-tailed log-rank test). (b) Log2 ratio of intra-tumoral expression levels of 28 type I interferon-stimulated genes (ISGs) in emactuzumab (anti-CSF-1R)-treated patients (n=31 patients) normalized against the pre-treatment expression levels. (c) Box plots of the expression level of the 11 statistically significant up-regulated type I ISGs in tumors of emactuzumab-treated patients (same data as in Fig. 4b). Expression levels in pre-treatment (baseline) tumor biopsies are compared to on-treatment (emactuzumab) biopsies. The topmost line is the maximum, the top of the box is the 3rd quartile, the center line is the median, the bottom of the box is the 1st quartile, the bottom-most line is the minimum. RPKM, reads per kilobase of exon per million mapped reads. P value was determined by two-tailed Student’s t-test.

