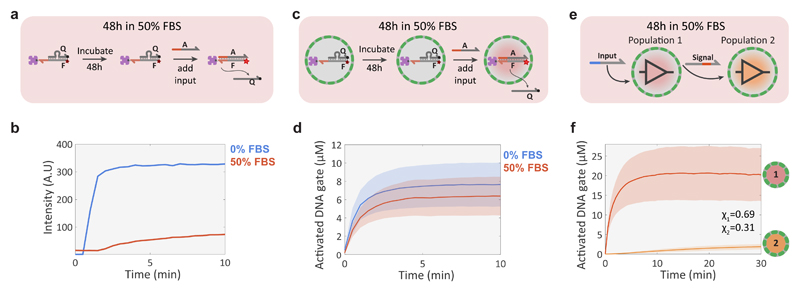
Figure 6. Compartmentalized DNA reaction networks in 50% FBS.
a, Experimental procedure for validating the stability of a streptavidin-bound quenched DNA gate complex (F:Q, 100 nM; streptavidin, 100 nM) in 50% FBS under batch conditions. The stability of the complex was determined by measuring the fluorescence associated with DSD activity after addition of input strand A (200 nM). b, Fluorescence traces for the batch DSD reaction in 0% (buffer only, blue trace) and 50% (red) FBS showing loss of activity in 50% FBS. c, Validation procedure for a compartmentalized version of the DSD reaction shown in a. d, Mean and standard deviation of protocell activation levels in 0% (buffer, blue trace) and 50% (red) FBS. The experiments were performed by incubating the DNA gate-containing proteinosomes for 48h in 50% FBS or 0% FBS, followed by adding 2 μM of input strand A to initiate the DSD reaction. High-P proteinosomes containing free BSA (60 mg/mL) were used to minimize osmotic collapse. e, Schematic representation of a simple non-catalytic transducer-receiver signalling cascade between two protocell populations incubated for 48 h in 50% FBS. Proteinosomes of population 1 sense the externally added input strand and respond by activating a Cy5 fluorescent DNA gate complex and secreting a signal strand that is sensed by population 2 to produce a Alexa546 fluorescent response. f, Mean and standard deviations of protocell activation levels for populations 1 and 2 of the 2-stage signalling cascade showing fluorescent activation in both populations. The reaction was started after 48h incubation in 50% FBS by adding 2 μM of the input strand. High-P proteinosomes containing free BSA (60 mg/mL) were used to minimize osmotic collapse.

