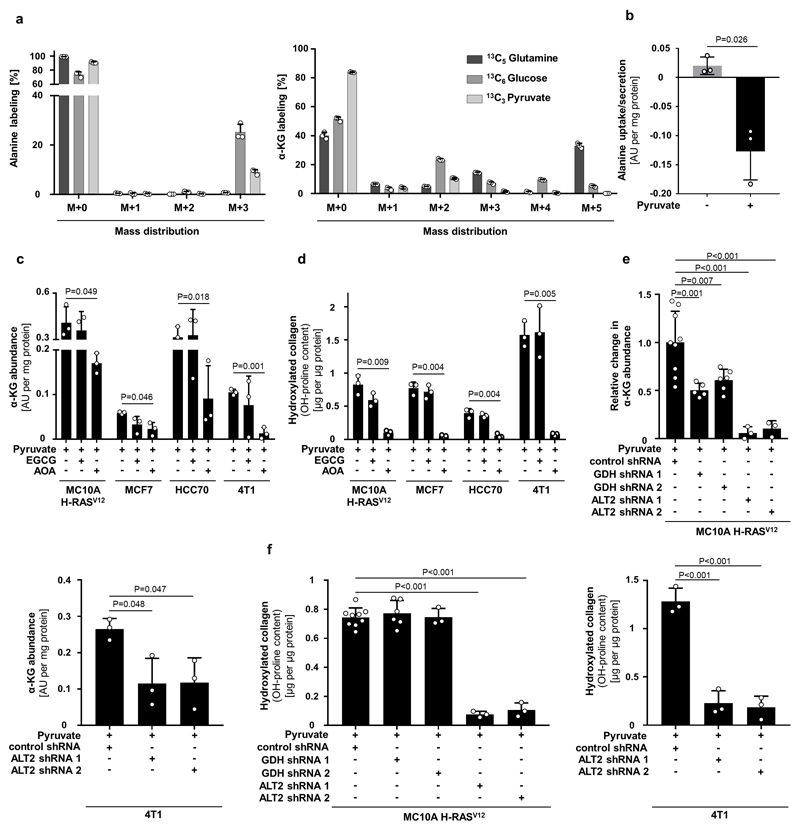
Extended Dataure Fig 5. Pyruvate to alanine conversion drives α-ketoglutarate production.
(a) Carbon contribution of 13C5 glutamine, 13C6 glucose, and 13C3 pyruvate to alanine and α-ketoglutarate (α-KG) assessed by 13C tracer analysis. n=3.
(b) Alanine uptake/secretion in MCF10A H-RasV12 spheroids with and without pyruvate measured by the mass spectrometry analysis of the media. n=3.
(c-f) Intracellular abundance of α-ketoglutarate (α-KG) and hydroxylated collagen in human and mouse breast cancer spheroids upon treatment with the transaminase inhibitor aminooxyacetate (AOA; 0.8 mM), the glutamate dehydrogenase inhibitor epigallocatechin gallate (EGCG; 50 µM), transduced with a lentiviral vector with shRNA for either mitochondrial ALT2 (KD), GDH (KD) or scrambled control sequence in the presence of pyruvate. n=3 for EGCG and AOA treatment (c-d); n=9 for control shRNA, n=6 for GDH shRNA 1 and 2 and n=3 for ALT2 shRNA1 and 2 (MCF10A H-RasV12, e-f); n=3 for control shRNA and ALT2 shRNA 1 and 2 (4T1, e-f). In case ALT activity majorly contributs to α-ketoglutarate generation, ECGC (which inhibits the pyruvate independent conversion of glutamate to α-ketoglutarate via the enzyme glutamate dehydrogenase (GDH)), should have a minor effect on α-ketoglutarate abundance and hydroxylated collagen. Indeed, we found that this was the case.
Error bars represent SD of mean from biological independent samples. Two-tailed unpaired student’s T-test.

