Fig. 1.
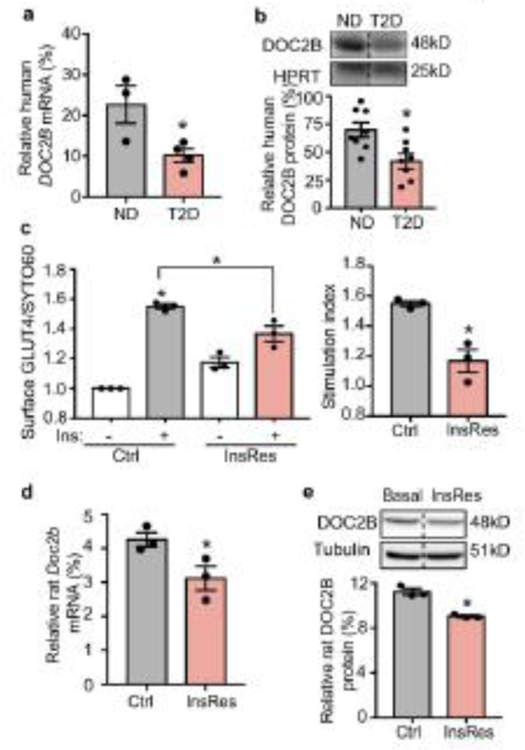
DOC2B expression is attenuated in the skeletal muscle of human type 2 diabetic donors and insulin-resistant L6-GLUT4-myc muscle cells. (a, b) Real-time PCR and western blot analyses of DOC2B mRNA (a) (n=3 for non-diabetic donors and n=4 for donors with type 2 diabetes) and DOC2B protein levels (b) (n=8 for non-diabetic donors and n=8 for donors with type 2 diabetes) in human skeletal muscle samples. The relative mRNA or protein level was calculated by normalising to HPRT. (c) PM GLUT4 level in control and InsRes L6-GLUT4-myc cells under basal conditions (−) and after 100 nmol/l insulin stimulation for 20 min (+). The immunofluorescence intensity of cell-surface GLUT4 was normalised to the nucleic acid staining dye SYTO 60. (d) The stimulation index was calculated as a ratio of the relative GLUT4 value in (c) after insulin stimulation, divided by relative GLUT4 value without insulin stimulation, under Ctrl or InsRes conditions. (e, f) Real-time PCR of Doc2b mRNA levels (e) and western blot analysis of DOC2B protein levels (f) in control and InsRes L6-GLUT4-myc cells. For (c–f) n=3. *p<0.05 vs ND/Ctrl, or as otherwise shown. Dashed vertical lines indicate splicing of lanes within the same gel exposure. Ctrl, control; HPRT, hypoxanthine guanine phosphoribosyl transferase; Ins, insulin; ND, non-diabetic donor; T2D, type 2 diabetic donor

