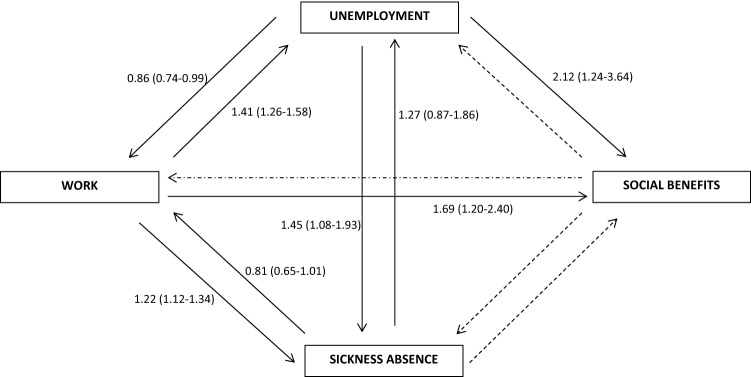
Fig. 5.
Hazard ratios and 95% confidence intervals for transitions between work, unemployment and sickness absence at baseline to work, unemployment, sickness absence and social benefits at follow-up according to problem drinking (CAGE-C score of 4–6). Reference group was no problem drinking. Dashed arrows represent transitions that was not possible to analyze, due to low power. The eight transitions were adjusted for age, gender, cohabitation status, educational level, Charlson Comorbidity Index, mental illness and disorders, smoking behaviour, geographic region and labour market status during the year prior to baseline

