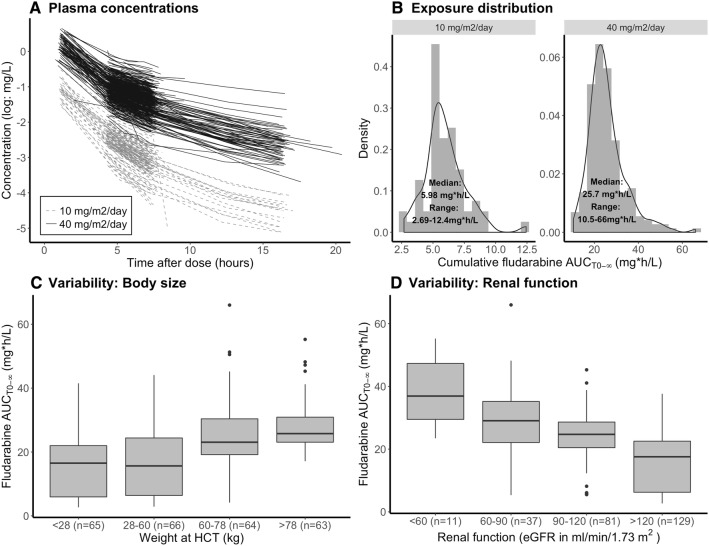
Fig. 1.
Exposure variability and covariates predicting variability. a Fludarabine plasma concentrations versus time after last dose on a logarithmic scale. Each line corresponds to a single dose, stratified to dose. b Histogram (grey area) and density plot (black solid line) of the observed AUCT0−∞. AUCT0−∞ of patients receiving a low dose (40 mg/m2) were normalized to 160 mg/m2. c Boxplots of AUCT0−∞ per weight quartile of observed AUCT0−∞. d Boxplots of observed AUCT0−∞ stratified for renal function. HCT hematopoietic cell transplantation, eGFR estimated glomerular filtration rate

