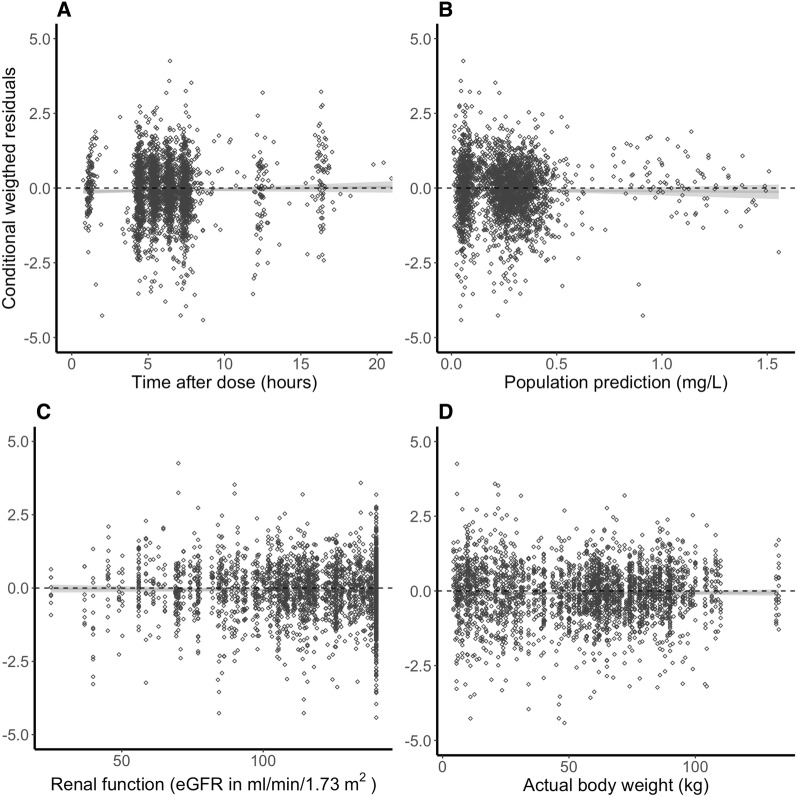
Fig. 3.
Conditional weighted residuals versus time after dose, population predictions, and covariates. a–d Depict the CWRES versus time after dose, the population predictions, renal function (eGFR) and actual body weight, respectively. Black open circles represent the CWRES values and the solid grey line is a local regression fit of these values. Dashed lines depict the zero-line. CWRES conditional weighted residuals, eGFR estimated glomerular filtration rate

