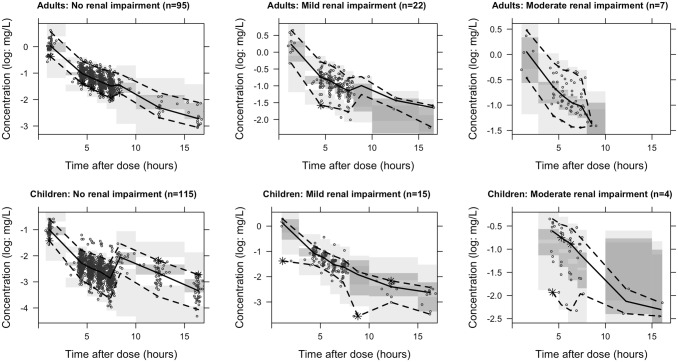
Fig. 4.
Stratified prediction-corrected visual predictive check. Black lines depict the observed median (solid) and 2.5% and 97.5% percentile (dashed) concentrations. Dark- and light-grey areas represent 95% prediction intervals of the simulated mean and the 2.5 and 97.5% percentiles, respectively. Round dots represent observations. Asterisks highlight observed percentiles outside the prediction area. Increased median concentrations after 8 h are caused by the prediction correction. Subjects for whom samples for these bins were available had higher actual body weights

