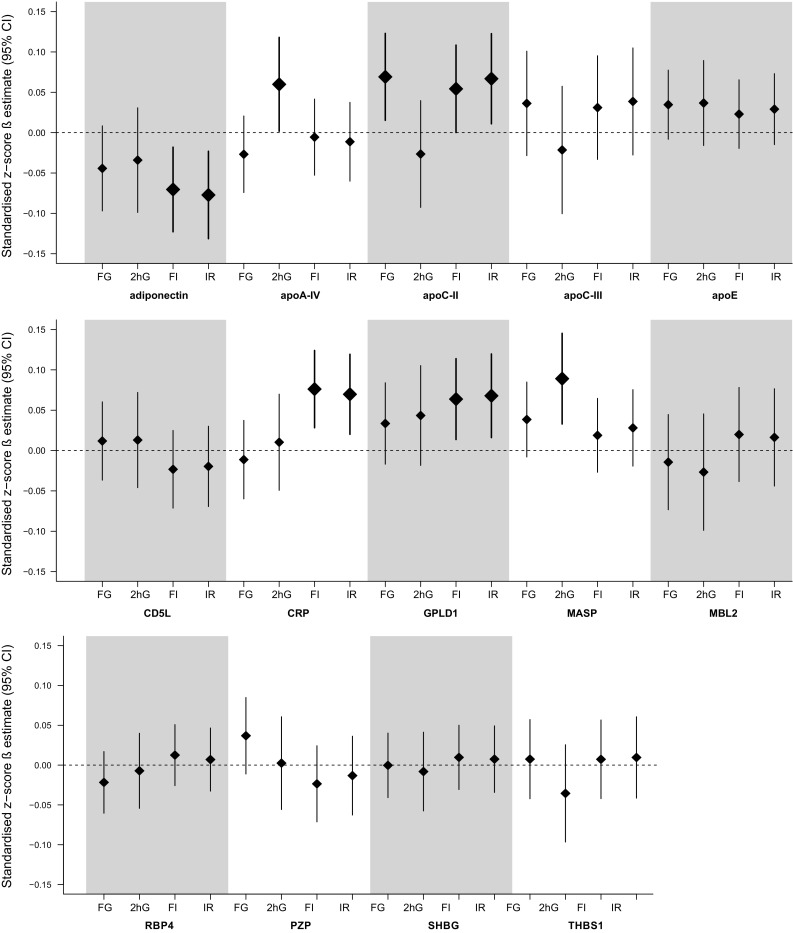
Fig. 3.

Estimated difference in continuous outcomes at follow-up for study participants not taking glucose-lowering medication expressed as the SD change in the continuous outcome (standardized z-score β estimate with 95% CI) per one sex-specific SD increase in the respective protein, adjusted for age, sex, waist circumference, height, smoking, physical inactivity, actual hypertension, triglyceride level, total cholesterol/HDL-cholesterol ratio (model 2a) and the baseline value of the investigated outcome variable. FG fasting glucose (n = 855); 2hG 2-h-glucose (n = 831); FI fasting insulin (n = 851), IR HOMA-insulin resistance (n = 851). Bars and diamonds of proteins associated statistically significantly are printed in bold. apoA-IV apolipoprotein A-IV; apoC-II apolipoprotein C-II; apoC-III apolipoprotein C-III; apoE apolipoprotein E; CD5L CD5 molecule-like; CRP C-reactive protein; GPLD1 glycosylphosphatidylinositol-specific phospholipase D1; MASP mannan-binding lectin serine peptidase; MBL2 mannose-binding lectin 2; PZP pregnancy-zone protein; RBP4 retinol-binding protein 4; SHBG sex hormone-binding globulin; THBS1 thrombospondin 1
