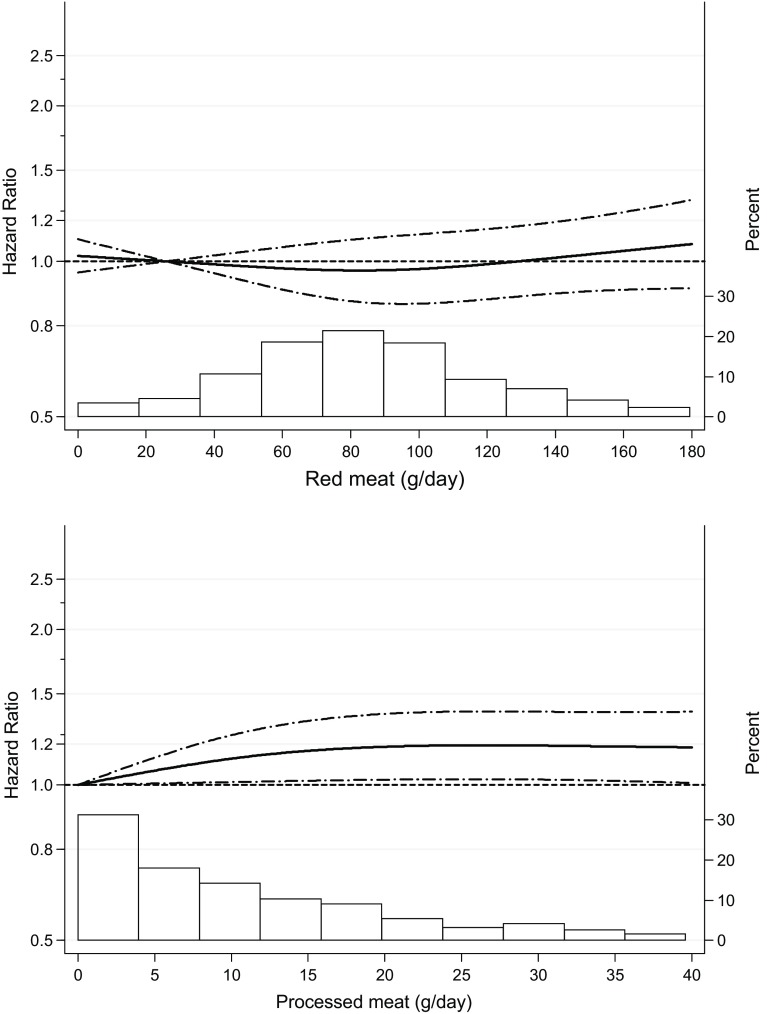
Fig. 1.
Spline regression curves for the association between (unprocessed) red meat (upper panel) and processed meat (lower panel) intake and total mortality. Solid lines represents point estimates and dashed lines represent 95% confidence intervals. Multivariable HRs were calculated by restricted cubic spline regression (using 3 knots at 10th, 50th, and 90th percentiles) adjusting for: age at baseline (continuous, in years), cigarette smoking status (coded as never, former, current smoker), number of cigarettes smoked per day, and years of smoking (both continuous, centered), history of physician-diagnosed hypertension (no, yes) and diabetes (no, yes), body height (continuous, m), BMI (< 18.5, 18.5 to < 25, 25 to < 30, ≥ 30 kg/m2), non-occupational physical activity (< 30, 30–60, 61–90, ≥ 90 min/day), highest level of education (primary school or lower vocational, secondary or medium vocational, and higher vocational or university), intake of alcohol (0, 0.1 to < 5, 5 to < 15, 15 to < 30, 30 + g/day), vegetables and fruit (both continuous, g/day), energy (continuous, kcal/day), use of nutritional supplements (no, yes), and, in women, postmenopausal HRT (never, ever). The histograms show the percentage of participants (right y axis) consuming each level of red meat and processed meat, respectively

