
Figure 1.
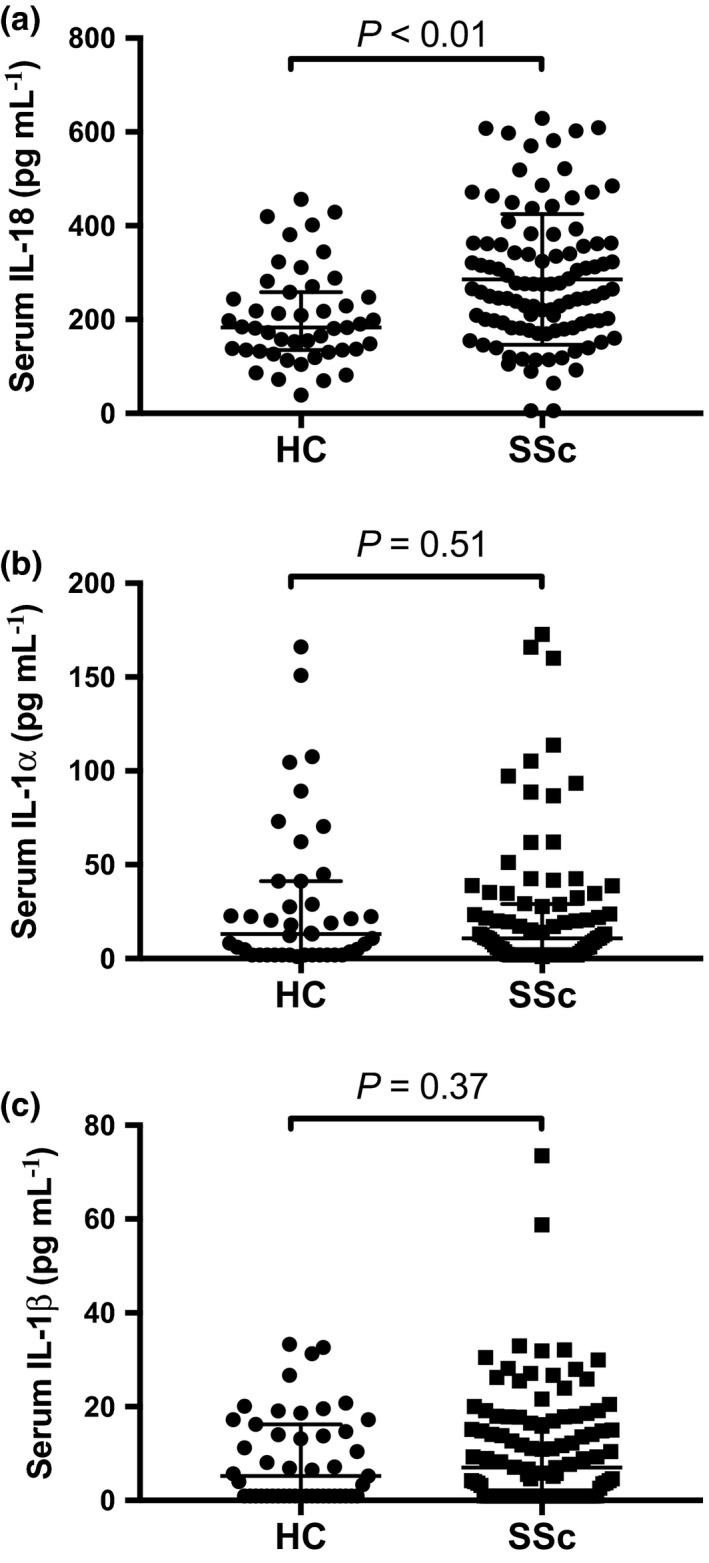
Serum IL‐1α, IL‐1β and IL‐18 concentrations in SSc and HC. (a) Serum IL‐18 concentrations in HC (N = 47) vs. SSc patients (N = 103). (b) Serum IL‐1α concentrations in HC (N = 42) vs. SSc patients (N = 87). (c) Serum IL‐1β concentrations in HC (N = 47) vs. SSc patients (N = 105). Horizontal bars indicate medians, and corresponding error bars indicate IQR; a Wilcoxon rank‐sum test was used to examine differences between two groups. All samples were run in duplicate.