
Figure 4.
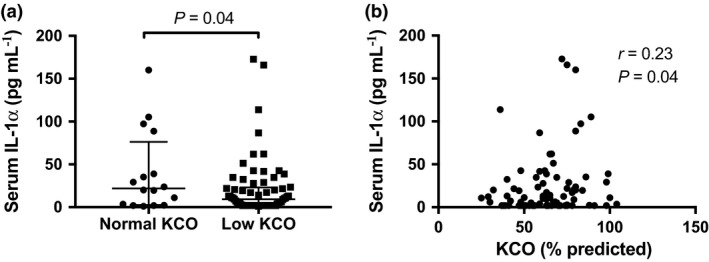
Serum IL‐1α and SSc clinical parameters. (a) Serum IL‐1α concentrations in patients with normal (n = 15) vs. low (n = 67) KCO (% predicted). (b) Correlation between serum IL‐1α concentration and KCO (% predicted) in SSc (N = 82). a: Horizontal bars indicate medians, and corresponding error bars indicate IQR; a Wilcoxon rank‐sum test was used to examine differences between two groups. b: A Spearman's correlation test was used to examine the correlation between two continuous variables.