
Figure 2.
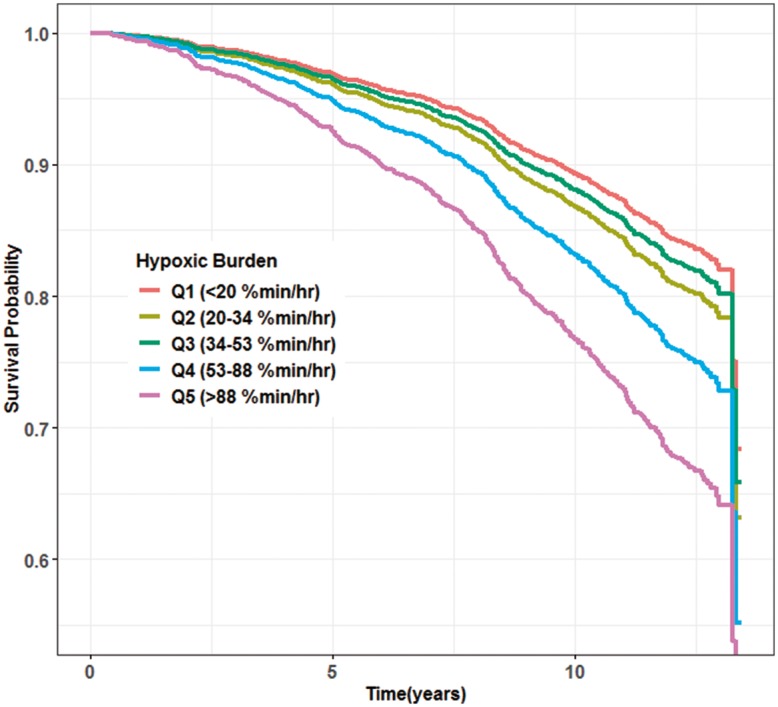
Adjusted survival curves for cardiovascular mortality across categories of the hypoxic burden in MrOS. These curves were obtained from Model 4. The adjusted survival curves were obtained by averaging the predicted survival curves for every observation in MrOS study.