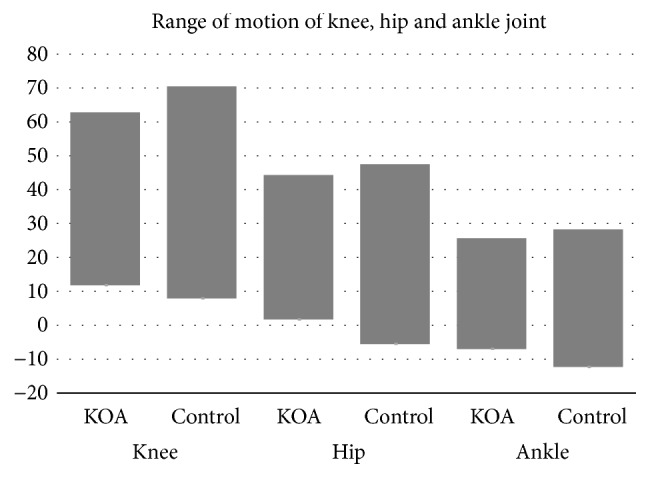
Figure 1.

Range of motion (ROM) of the knee, hip, and ankle joint. The knee OA (KOA) group showed smaller ROM than the control group. In the knee joint, a negative value indicates hyperextension. In the hip joint, a negative value indicates extension. In the ankle joint, a negative value indicates plantar flexion.
