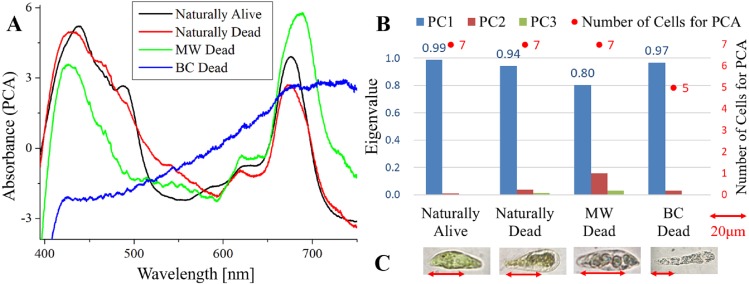
Figure 1. Principal component analysis (PCA) of absorption spectra of E. gracilis in CM medium.
(A) First principal component (PC1) of absorption spectra of single cells (B) Eigenvalues of PC1 to PC3 in single cell absorption spectra and the numbers of cells for PCA (C) Bright field microscopic image of cells with the inverted microscope (IX71, OLYMPUS) with the 100× objective lens of NA 0.85 (LCPlanFLN, OLYMPUS) Details of each sample are summarized in Table 4. Since the BC solution is transparent, it does not itself stain cells (also for Figs. 2 to 5).

