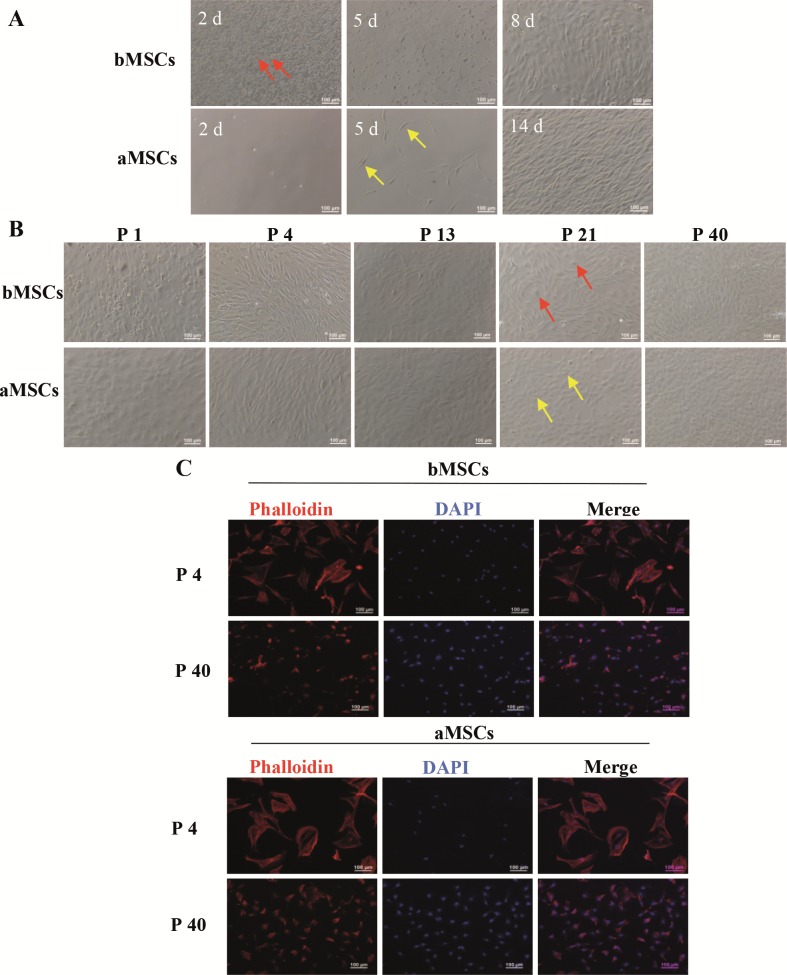
Figure 2.
The morphology of bMSCs and aMSCs in primary and long-term cultures. A) Phase-contrast images of primary culture after different time intervals. The cells pointed out by the red arrow and the yellow arrow are spindle-shaped bMSCs and aMSCs, respectively. B) phase-contrast images after 6 days in culture at different passages. The cells pointed out by the red arrow and the yellow arrow are rounded cells and oval cells, respectively. C) Fluorescence images of F-actin staining after 24 h in culture at passages 4 and 40.

