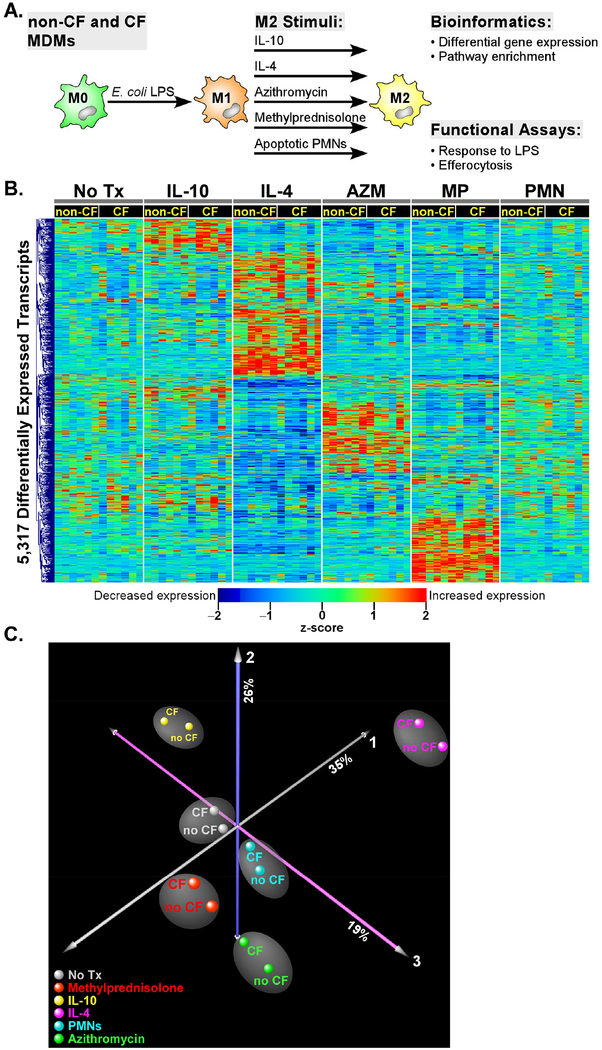
Figure 1. Overview of experimental design.
(A) Blood monocytes from 6 non-CF and 6 CF donors were cultured with M-CSF over 7 days to produce MDMs. Cells were stimulated with E. coli LPS for 24h and then repolarized with IL-10, IL-4, azithromycin, methylprednisolone, apoptotic PMNs, or control media for 24 h. Cells were then processed for gene expression and functional assays. (B) Hierarchical cluster analysis of a total of 5,317 differentially expressed genes in non-CF and CF subjects across the five M2 stimuli. Note the distinct transcriptional pattern associated with each exposure, and the overall similar expression profile between non-CF and CF subjects. An FDR < 0.01 cutoff was used to designate significant differential expression in each M2 exposure relative to baseline (no treatment). (C) Principal Component Analysis. To simplify visualization of the 72 experiments, differentially expressed transcriptional profiles were averaged in CF (n = 6) and non-CF (n = 6) subjects for each M2 stimulus. Each orthogonal axis captures a percentage of the total gene expression variability, with ~80% of the variance captured by the three axes. Note that the non-CF and CF samples segregate based on M2 stimuli, implying that the primary determinant of separation between groups is exposure, not genotype

