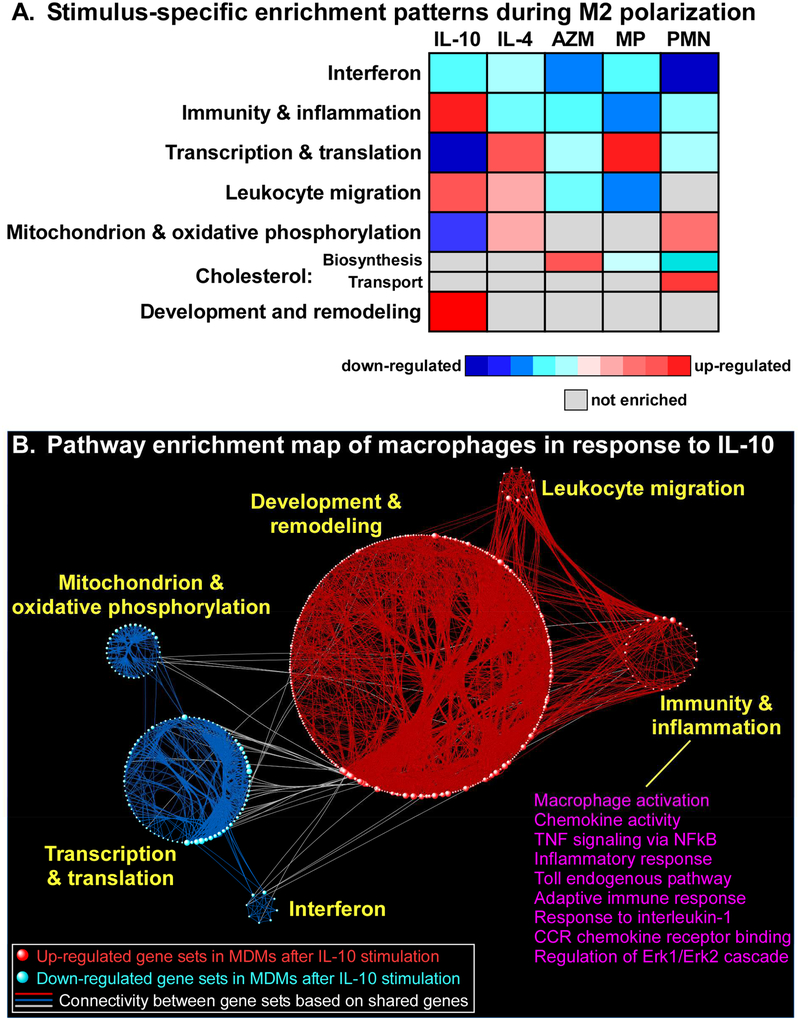
Figure 2. Visual summary of pathway analysis.
(A) GSEA of the transcriptional response to M2-polarizing stimuli identified many differentially up and down-regulated pathways. Network analysis was used to group these pathways into seven larger aggregates known as modules. Note the divergent enrichment pattern across conditions, although common themes such as suppression of interferon-associated pathways are also revealed from this analysis. Complete list of enriched gene sets is provided in Supplemental Table E3. (B) Network-based visualization of the GSEA of MDM response to IL-10 treatment illustrates the emergence of modules comprised of interconnected pathways (shown as spheres). Unlike other M2 stimuli, exposure to IL-10 activated multiple immune-related programs, several of which are listed.

