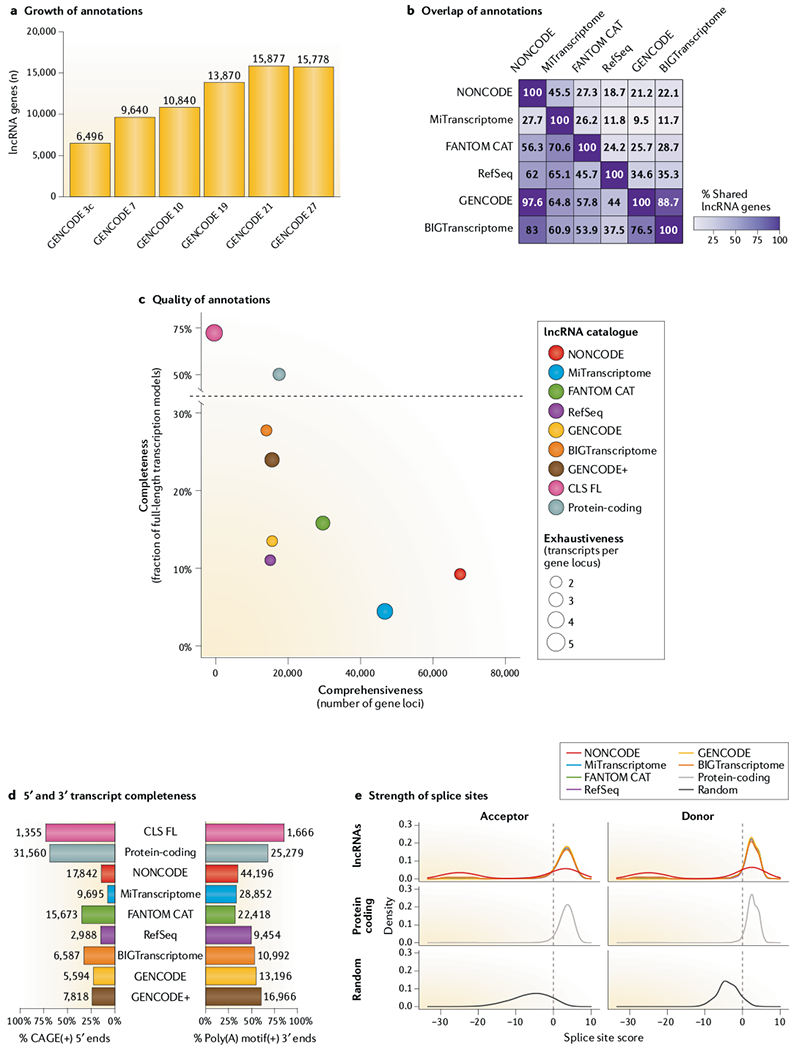
Fig. 3 |. Comparison of leading lncRNA annotations.

a | Growth of GENCODE long non-coding RNA (lncRNA) collection over time, in terms of gene loci. Only reference releases are included. b | Overlap between annotations at the gene level, based on a medium-stringency definition. Values represent the percentage of gene loci in the annotation of each row that overlap the annotation in each column. Overlap is defined as at least 60% of the span of the shorter gene on the same strand. Only genes with at least one multiexonic transcript were included. See TABLE 1 for details. c | Comparison of quality metrics between annotations. x-axis: comprehensiveness, or the total number of gene loci; y-axis: completeness, or percentage of transcript structures whose start is supported by a robust phase 1/2 Functional Annotation of the Mammalian genome (FANTOM) cap analysis of gene expression (CAGE) cluster (n = 201,802) within ±50 bases and whose end contains a canonical polyadenylation motif154 within a window of 10–50 bp upstream. Circle diameters reflect exhaustiveness, or mean number of transcripts per gene. GENCODE+ is the union of GENCODE version 20 with non-anchor-merged capture long-read sequencing (CLS) transcript models. Protein-coding is a set of confident GENCODE protein-coding transcripts as described in REF.27. d | As for part c, but separately for 5′ and 3′ completeness. e | The distribution of predicted splice junction strength for splice site acceptors and donors in each lncRNA catalogue, as calculated by the GeneID software155. The plots show non-redundant splice sites from lncRNA annotations sets (top), confident GENCODE protein-coding transcripts (middle), and 500,000 randomly selected GC|GT donors + AG acceptors with no evidence of splicing in any of the annotation sets under study (bottom). For each non-canonical splice site not scored by GeneID, a random score between −30 and −20 was assigned.
