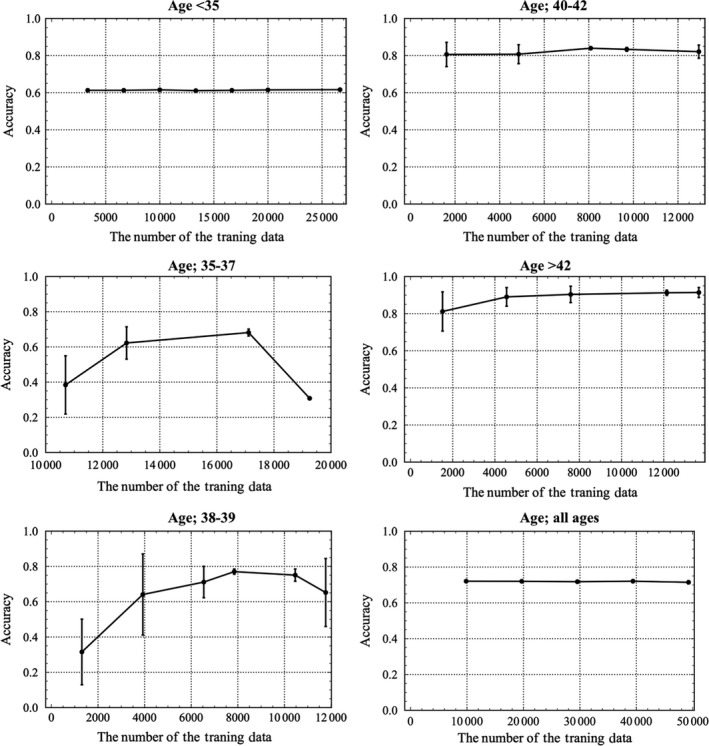
Figure 2.

The profiles for accuracy with standard deviation (SD) according to the number of training data and classified by age into <35, 35‐37, and 38‐39 y are shown above in the left column, while those for 40‐41 and ≥42 y and all ages are shown above in the right column. The number of training data that achieved the best accuracy with the minimum SD was obtained for each age category. For patients aged <35 y and all ages, the accuracies do not differ; thus, the best number for the training data was determined according to the maximum number of the sum of the sensitivity and the specificity. The best numbers for the training data were 16 665, 17 112, 7848, 8085, 12 144, and 49 245 for patients aged <35, 35‐37, 38‐39, 40‐41, and ≥42‐y and all ages, respectively
