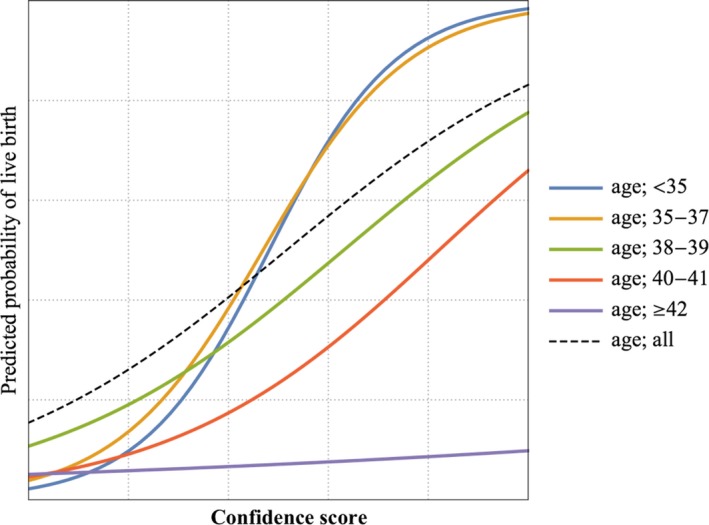
Figure 4.

The functions used to predict the probability of live birth are plotted according to age categories into <35, 35‐37, 38‐39, 40‐41, and ≥42 y and all ages, respectively. The functions for ages <35 and for 35‐37 y seemed similar. When the age advanced above 35 y, and especially when it was equal to or greater than 42 y, the probability of live birth decreased. These functions, which were derived from artificial intelligence, seemed to be consistent with the significance of age
