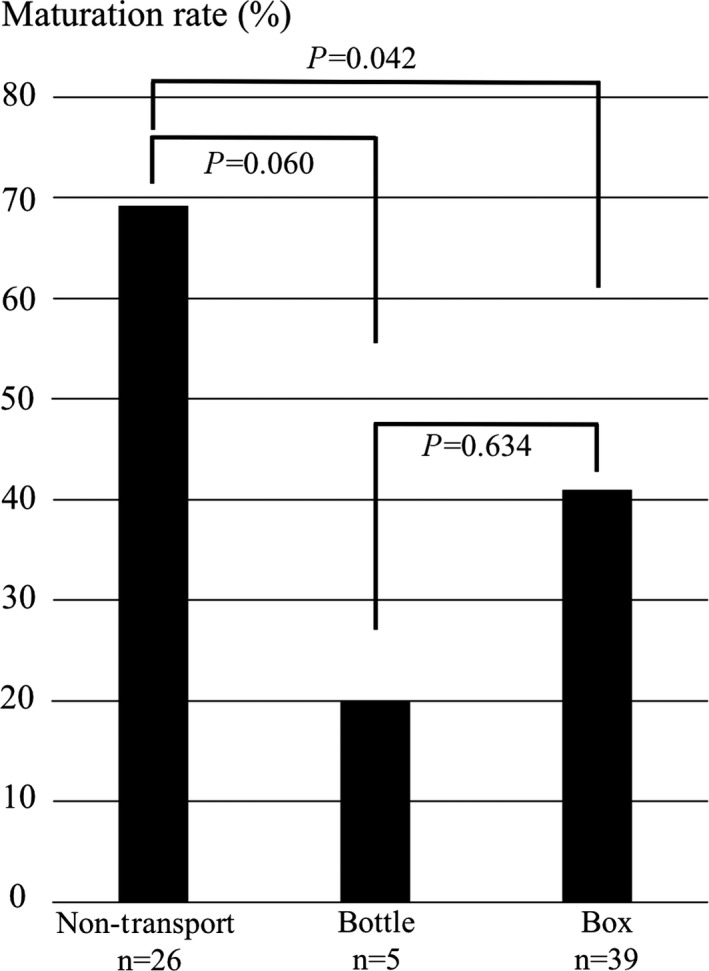
Figure 4.

Comparison of maturation rates in the transportation and non‐transportation groups. Non‐Transport, non‐transportation group; Bottle, bottle group; Box, box group. The bars indicate the percentages of oocytes that reached mature metaphase II as a result of in vitro maturation. Two‐sided Fisher's exact test was used for statistical analysis
