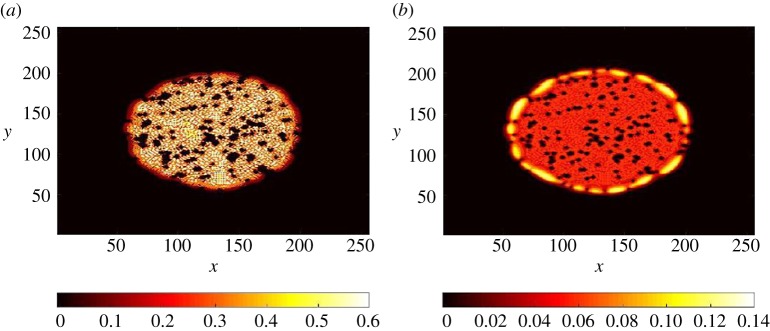
Figure 6.
Distribution of cells computed with the two-dimensional mixture model including cancer stem cells, differentiated cells and inert cells (dead, of different type such as blood cells). The computation was seeded from a small number of cells. (a) Differentiated cell distribution. (b) Cancer stem cell distribution. The black dots represent obstacles (vessels, fibres). This numerical computation includes a chemical signal exchange in between cells (such as growth factors) and growth feedback control loops (unpublished preliminary data [127]). (Online version in colour.)

