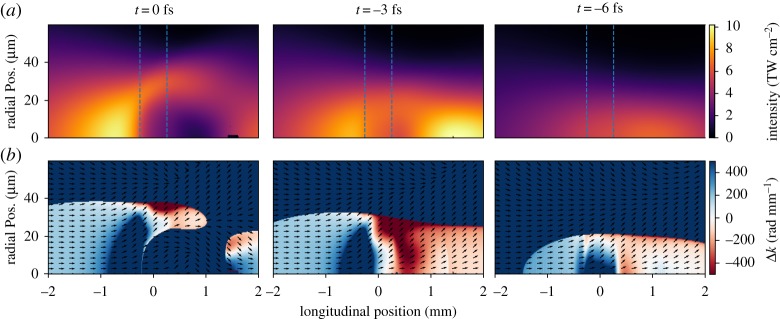
Figure 3.
(a) Peak intensity and (b) short-trajectory phasematching maps for the three most important half-cycles (columns) for 350 eV photon emission from 4 bar of helium when a pulse of 550 μJ and CEP = 0.3π is focused 1.4 mm after the target. The corresponding times of the half-cycles relative to the driving field envelope before the target are indicated above, and the dashed blue lines indicate the extent of the gas target. (Online version in colour.)

