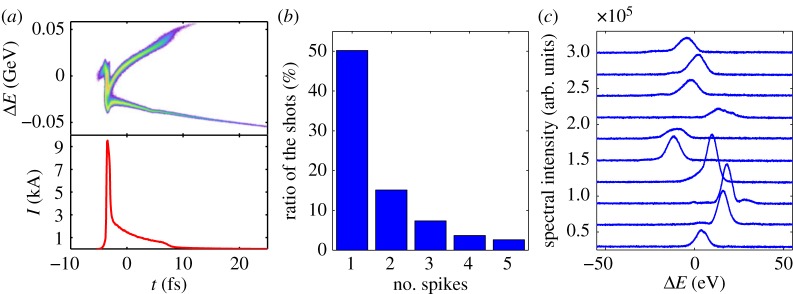
Figure 2.
(a) Simulated longitudinal phase space (top) and current profile (bottom) of the nonlinearly compressed electron beam. (b) Percentage of shots with a given number of SASE spikes in the nonlinearly compressed electron beam. (c) Examples of measured single-spike spectra [30]. (Online version in colour.)

