Figure 9.
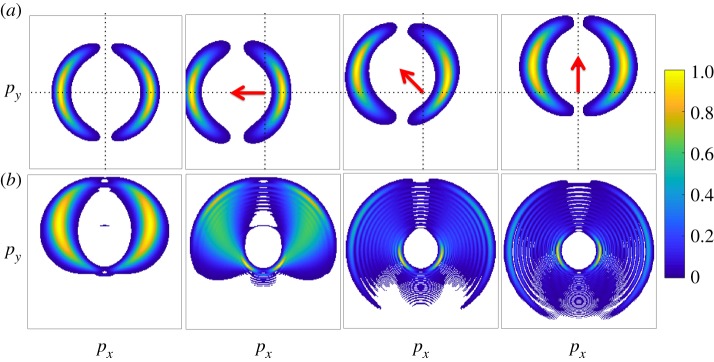
Simulated photoelectron momentum distributions resulting from two-colour ionization. This figure shows two-dimensional slices of the three-dimensional momentum distribution in the plane perpendicular to the X-ray propagation direction. (a) The results for a Fourier transform-limited Gaussian X-ray pulse with 300 as full-width-at-half-maximum duration. The angular distribution of the photoelectrons is a dipole pattern, characteristic of photoionization of a 1 s atomic orbital with linearly polarized X-ray pulses. In the left panel, the streaking field intensity is set to zero. Subsequent panels in the top row demonstrate the effect of the streaking laser field on the projected photoelectron momentum distribution for different delays between the X-ray pulse and the streaking laser field. The arrow indicates the direction of the instantaneous dressing laser vector potential at the peak of the attosecond pulse. (b) The effect of the X-ray pulse duration on the slice momentum distribution when the streaking laser field is directed along the py axis (as in the right panel of (a)). From left to right along (b), the X-ray pulse duration is 600 as, 1.2 fs, 2.4 fs and 4.8 fs. The simulation considers 25 eV photoelectrons interacting with a 1.3 μm laser field with Up = 4 eV (where Up = |A0|2/4 is the ponderomotive potential of the streaking laser field). The photoelectron momentum distribution intensity is normalized to 1. (Online version in colour.)

