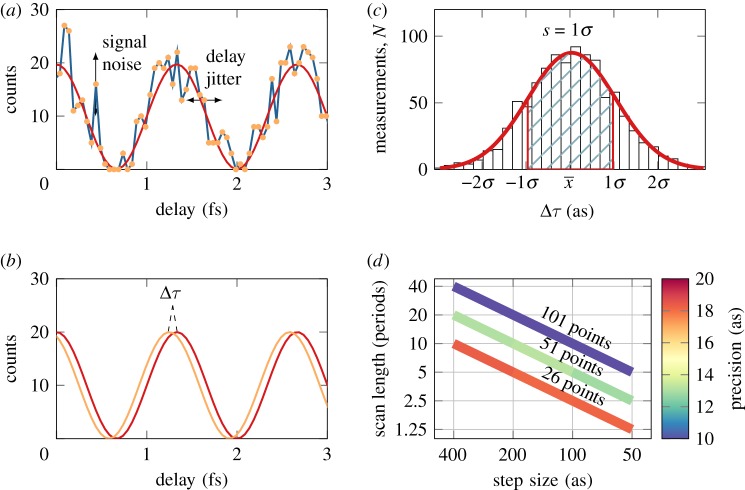
Figure 2.
Illustration of the model used to simulate RABBIT traces. (a) A RABBIT oscillation, on which temporal jitter and signal fluctuations are added; (b) determination of the phase difference between the best fit and the original function; (c) after repetition of this procedure N times, the precision can be determined as the standard deviation of the distribution function; (d) precision (in colour) as a function of scan length and step size for different number of sampling points, with a temporal jitter, σt, of 25 as. No signal and background noise was taken into account.

